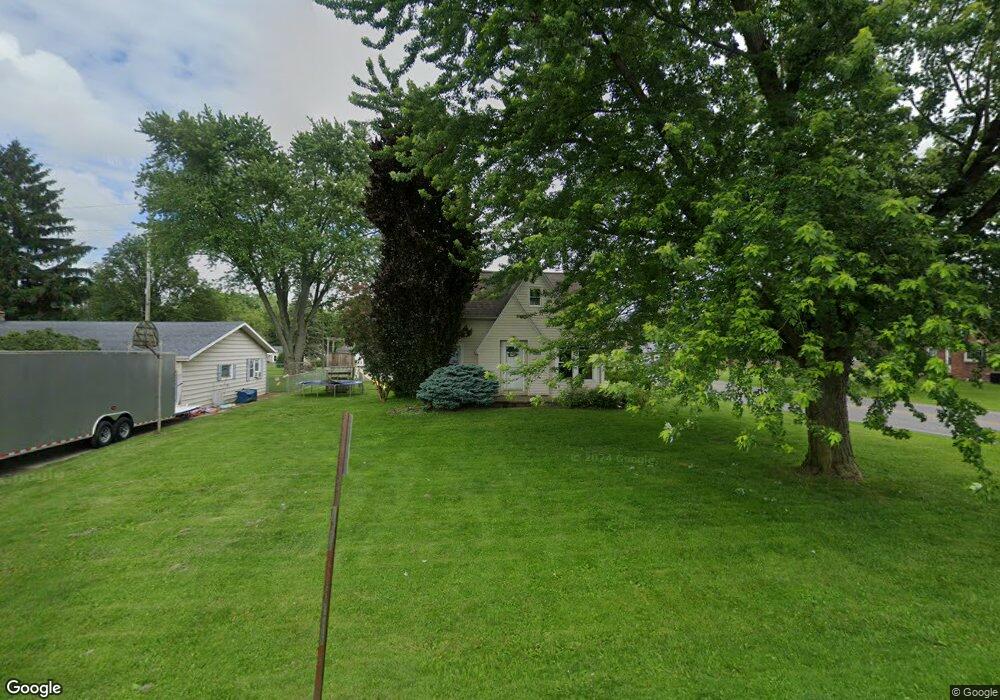
1747 Tiffin Rd Fremont, OH 43420
Estimated Value: $131,000 - $172,000
3
Beds
1
Bath
1,120
Sq Ft
$133/Sq Ft
Est. Value
About This Home
This home is located at 1747 Tiffin Rd, Fremont, OH 43420 and is currently estimated at $149,312, approximately $133 per square foot. 1747 Tiffin Rd is a home located in Sandusky County with nearby schools including Fremont Ross High School, Bishop Hoffman Catholic School - This is St Joe's School now, and St. Joseph School.
Ownership History
Date
Name
Owned For
Owner Type
Purchase Details
Closed on
Mar 5, 2024
Sold by
Morris John J and Morris Michelle R
Bought by
Delbrocco Joseph J and Delbrocco Del Brocco
Current Estimated Value
Home Financials for this Owner
Home Financials are based on the most recent Mortgage that was taken out on this home.
Original Mortgage
$90,800
Outstanding Balance
$89,290
Interest Rate
6.63%
Mortgage Type
New Conventional
Estimated Equity
$60,022
Purchase Details
Closed on
Nov 1, 1992
Sold by
Morris John J and Morris Michell
Bought by
Morris John J and Morris Michelle R
Purchase Details
Closed on
Dec 1, 1991
Sold by
Morris John J and Morris Michell
Bought by
Morris John J and Morris Michelle R
Purchase Details
Closed on
Mar 1, 1987
Sold by
Morris John J and Morris Michell
Bought by
Morris John J and Morris Michelle R
Purchase Details
Closed on
Jan 1, 1986
Bought by
Morris John J and Morris Michelle R
Create a Home Valuation Report for This Property
The Home Valuation Report is an in-depth analysis detailing your home's value as well as a comparison with similar homes in the area
Home Values in the Area
Average Home Value in this Area
Purchase History
| Date | Buyer | Sale Price | Title Company |
|---|---|---|---|
| Delbrocco Joseph J | $113,500 | None Listed On Document | |
| Morris John J | $39,500 | -- | |
| Morris John J | -- | -- | |
| Morris John J | -- | -- | |
| Morris John J | $38,500 | -- |
Source: Public Records
Mortgage History
| Date | Status | Borrower | Loan Amount |
|---|---|---|---|
| Open | Delbrocco Joseph J | $90,800 |
Source: Public Records
Tax History Compared to Growth
Tax History
| Year | Tax Paid | Tax Assessment Tax Assessment Total Assessment is a certain percentage of the fair market value that is determined by local assessors to be the total taxable value of land and additions on the property. | Land | Improvement |
|---|---|---|---|---|
| 2024 | $1,799 | $45,230 | $10,750 | $34,480 |
| 2023 | $1,799 | $31,650 | $7,530 | $24,120 |
| 2022 | $1,344 | $31,650 | $7,530 | $24,120 |
| 2021 | $1,384 | $31,650 | $7,530 | $24,120 |
| 2020 | $1,254 | $28,110 | $7,530 | $20,580 |
| 2019 | $1,253 | $28,110 | $7,530 | $20,580 |
| 2018 | $1,220 | $28,110 | $7,530 | $20,580 |
| 2017 | $1,084 | $25,420 | $7,530 | $17,890 |
| 2016 | $950 | $25,420 | $7,530 | $17,890 |
| 2015 | $934 | $25,420 | $7,530 | $17,890 |
| 2014 | $903 | $23,530 | $7,390 | $16,140 |
| 2013 | $884 | $23,530 | $7,390 | $16,140 |
Source: Public Records
Map
Nearby Homes
- 350 Conner Dr
- 10 Meadowbrook Dr
- 10 Meadowbrook Ln
- 1818 Finley Dr
- 64 River Run Dr Unit J
- 135 Briarwood Cir
- 1420 Center St
- 1970 Morrison Rd
- 1832 Myrtle St
- 1485 Autumn Woods Dr
- 1719 Buckland Ave
- 933 E Cole Rd
- 18 Katlyn Dr
- 1013 Whittlesey St
- 905 Twinn St
- 1028 June St
- 2484 Buckland Ave
- 625 Bush Place
- 815 South St
- 616 S Wood St
- 1741 Tiffin Rd
- 1803 Tiffin Rd
- 1733 Tiffin Rd
- 1725 Tiffin Rd
- 1201 W Cole Rd
- 1738 Tiffin Rd
- 1813 Tiffin Rd
- 1732 Tiffin Rd
- 1721 Tiffin Rd
- 1812 Robert Ave
- 1812 Tiffin Rd
- 1726 Tiffin Rd
- 1821 Tiffin Rd
- 1110 W Cole Rd
- 1106 W Cole Rd
- 1109 W Cole Rd
- 1720 Tiffin Rd
- 1713 Tiffin Rd
- 1820 Robert Ave
- 1818 Tiffin Rd