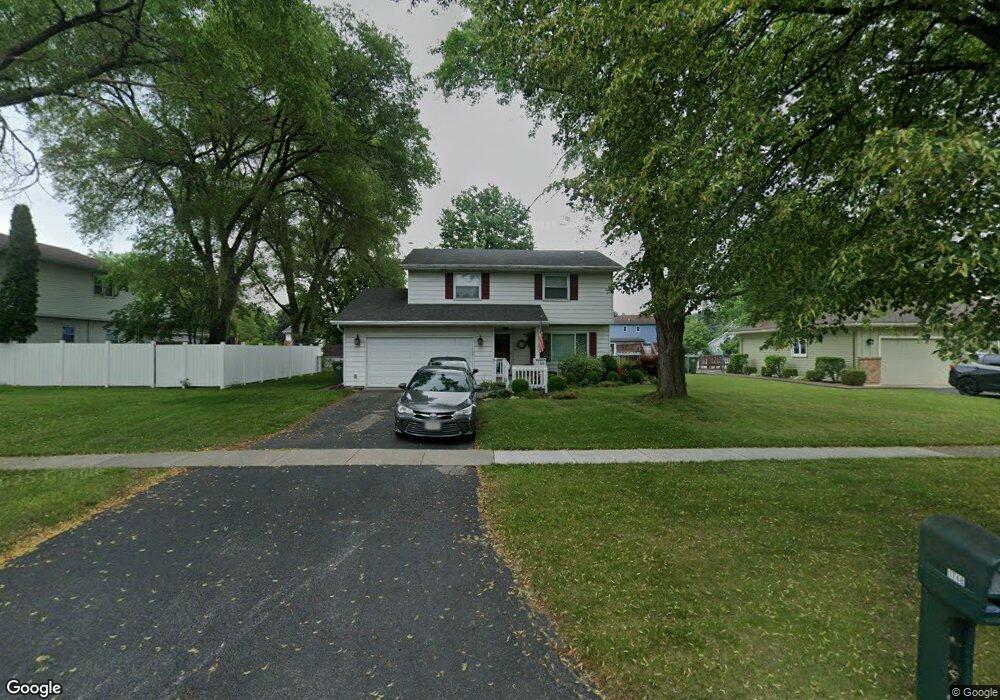
1748 Cass Rd Maumee, OH 43537
Estimated Value: $236,000 - $266,000
4
Beds
3
Baths
1,867
Sq Ft
$136/Sq Ft
Est. Value
About This Home
This home is located at 1748 Cass Rd, Maumee, OH 43537 and is currently estimated at $253,775, approximately $135 per square foot. 1748 Cass Rd is a home located in Lucas County with nearby schools including Fairfield Elementary School, Maumee Intermediate School, and Maumee Middle School.
Ownership History
Date
Name
Owned For
Owner Type
Purchase Details
Closed on
Aug 2, 2003
Sold by
Millner Daniel G and Millner Debra L
Bought by
Vermilyea Charles E and Vermilyea Joyce M
Current Estimated Value
Purchase Details
Closed on
Jun 14, 2001
Sold by
Herron Lee A and Herron Wendy S
Bought by
Millner Daniel G and Millner Debra L
Home Financials for this Owner
Home Financials are based on the most recent Mortgage that was taken out on this home.
Original Mortgage
$95,000
Interest Rate
5.5%
Purchase Details
Closed on
Jan 29, 1998
Sold by
Brannen David L and Brunnen Drucilla A
Bought by
Herron Lee A and Herron Wendy S
Home Financials for this Owner
Home Financials are based on the most recent Mortgage that was taken out on this home.
Original Mortgage
$91,400
Interest Rate
6%
Purchase Details
Closed on
Mar 1, 1988
Sold by
Coleman Steve
Create a Home Valuation Report for This Property
The Home Valuation Report is an in-depth analysis detailing your home's value as well as a comparison with similar homes in the area
Home Values in the Area
Average Home Value in this Area
Purchase History
| Date | Buyer | Sale Price | Title Company |
|---|---|---|---|
| Vermilyea Charles E | $145,000 | Louisville Title Agency For | |
| Millner Daniel G | $131,500 | Louisville Title Agency For | |
| Herron Lee A | $116,000 | -- | |
| -- | $79,800 | -- |
Source: Public Records
Mortgage History
| Date | Status | Borrower | Loan Amount |
|---|---|---|---|
| Previous Owner | Millner Daniel G | $95,000 | |
| Previous Owner | Herron Lee A | $91,400 |
Source: Public Records
Tax History
| Year | Tax Paid | Tax Assessment Tax Assessment Total Assessment is a certain percentage of the fair market value that is determined by local assessors to be the total taxable value of land and additions on the property. | Land | Improvement |
|---|---|---|---|---|
| 2025 | -- | $66,500 | $10,430 | $56,070 |
| 2024 | $2,344 | $71,330 | $10,430 | $60,900 |
| 2023 | $3,453 | $44,450 | $11,130 | $33,320 |
| 2022 | $3,066 | $44,450 | $11,130 | $33,320 |
| 2021 | $3,229 | $44,450 | $11,130 | $33,320 |
| 2020 | $3,429 | $42,595 | $10,640 | $31,955 |
| 2019 | $3,345 | $42,595 | $10,640 | $31,955 |
| 2018 | $3,288 | $42,595 | $10,640 | $31,955 |
| 2017 | $3,295 | $41,615 | $8,750 | $32,865 |
| 2016 | $3,259 | $118,900 | $25,000 | $93,900 |
| 2015 | $3,243 | $118,900 | $25,000 | $93,900 |
| 2014 | $2,350 | $40,820 | $8,580 | $32,240 |
| 2013 | $2,350 | $40,820 | $8,580 | $32,240 |
Source: Public Records
Map
Nearby Homes
- 504 Fairfield Park Dr
- 324 Oxford Ct
- 632 Brahier Ln
- 1371 Junior Dr
- 4237 Brogan Dr
- 224 Sackett St
- 213 E Indiana Ave
- 402 E Indiana Ave
- 306 Clinton St
- 408 Clinton St
- 1313 Birch Ave
- 706 Waite Ave
- 1057 Keeler St
- 1036 River Rd
- 2177 Thornapple Dr
- 4035 Greencrest Ln
- 1033 Anderson Ave
- 326 E Dudley St
- 5125 Stengel Ave
- 1004 Birch Ave
- 1744 Cass Rd
- 1749 Ashfield Dr
- 1740 Cass Rd
- 1745 Ashfield Dr
- 1753 Ashfield Dr
- 426 Chesterfield Ln
- 1741 Ashfield Dr
- 1737 Cass Rd
- 1736 Cass Rd
- 1800 Cass Rd
- 1733 Cass Rd
- 505 Fairfield Park Dr
- 1737 Ashfield Dr
- 509 Fairfield Park Dr
- 1729 Cass Rd
- 1732 Cass Rd
- 429 Chesterfield Ln
- 513 Fairfield Park Dr
- 1742 Ashfield Dr
- 1733 Ashfield Dr