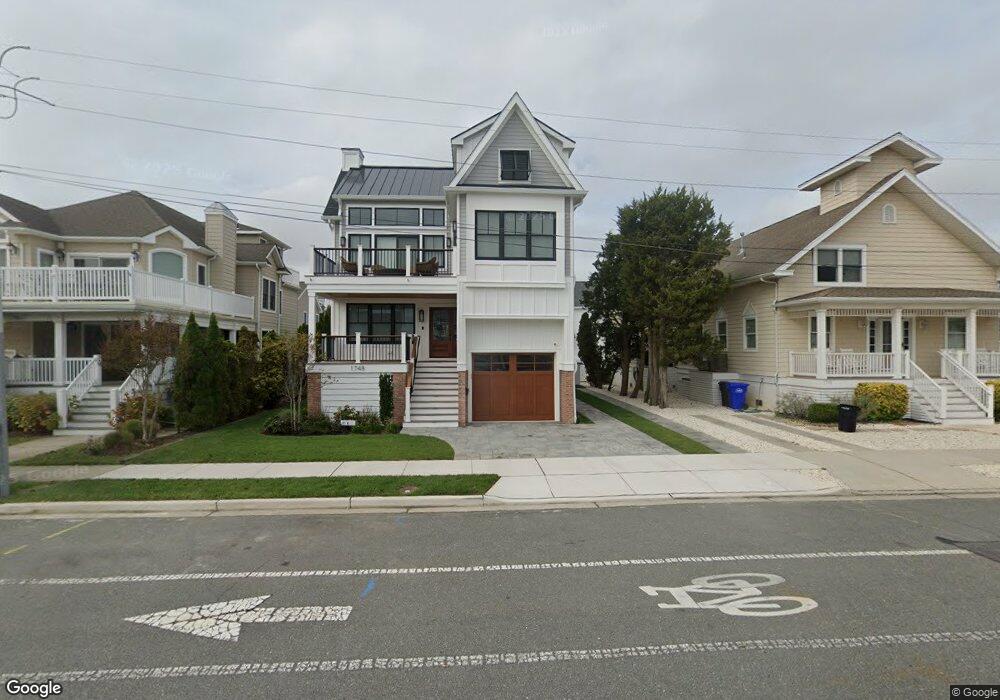
1748 Dune Dr Avalon, NJ 08202
Estimated Value: $1,948,000 - $2,553,933
3
Beds
2
Baths
1,716
Sq Ft
$1,376/Sq Ft
Est. Value
About This Home
This home is located at 1748 Dune Dr, Avalon, NJ 08202 and is currently estimated at $2,361,483, approximately $1,376 per square foot. 1748 Dune Dr is a home located in Cape May County with nearby schools including Avalon Elementary School.
Ownership History
Date
Name
Owned For
Owner Type
Purchase Details
Closed on
Oct 16, 2024
Sold by
St Anthony Guild
Bought by
Ohara Michael Paul and Ohara Georgina Louise
Current Estimated Value
Home Financials for this Owner
Home Financials are based on the most recent Mortgage that was taken out on this home.
Original Mortgage
$1,450,000
Outstanding Balance
$1,433,719
Interest Rate
6%
Mortgage Type
New Conventional
Estimated Equity
$927,764
Purchase Details
Closed on
Feb 16, 2000
Create a Home Valuation Report for This Property
The Home Valuation Report is an in-depth analysis detailing your home's value as well as a comparison with similar homes in the area
Home Values in the Area
Average Home Value in this Area
Purchase History
| Date | Buyer | Sale Price | Title Company |
|---|---|---|---|
| Ohara Michael Paul | $2,200,000 | Seaboard Title | |
| Ohara Michael Paul | $2,200,000 | Seaboard Title | |
| Ohara Michael Paul | $2,200,000 | Seaboard Title | |
| -- | -- | -- |
Source: Public Records
Mortgage History
| Date | Status | Borrower | Loan Amount |
|---|---|---|---|
| Open | Ohara Michael Paul | $1,450,000 | |
| Closed | Ohara Michael Paul | $1,450,000 |
Source: Public Records
Tax History Compared to Growth
Tax History
| Year | Tax Paid | Tax Assessment Tax Assessment Total Assessment is a certain percentage of the fair market value that is determined by local assessors to be the total taxable value of land and additions on the property. | Land | Improvement |
|---|---|---|---|---|
| 2025 | $5,045 | $800,000 | $800,000 | -- |
| 2024 | $5,045 | $821,600 | $800,000 | $21,600 |
| 2023 | $5,004 | $821,600 | $800,000 | $21,600 |
| 2022 | $4,667 | $821,600 | $800,000 | $21,600 |
| 2021 | $4,483 | $821,600 | $800,000 | $21,600 |
| 2020 | $4,322 | $821,600 | $800,000 | $21,600 |
| 2019 | $4,190 | $821,600 | $800,000 | $21,600 |
| 2018 | $4,009 | $821,600 | $800,000 | $21,600 |
| 2017 | $3,904 | $702,200 | $675,000 | $27,200 |
| 2016 | $3,862 | $702,200 | $675,000 | $27,200 |
| 2015 | $3,799 | $702,200 | $675,000 | $27,200 |
| 2014 | $3,757 | $702,200 | $675,000 | $27,200 |
Source: Public Records
Map
Nearby Homes