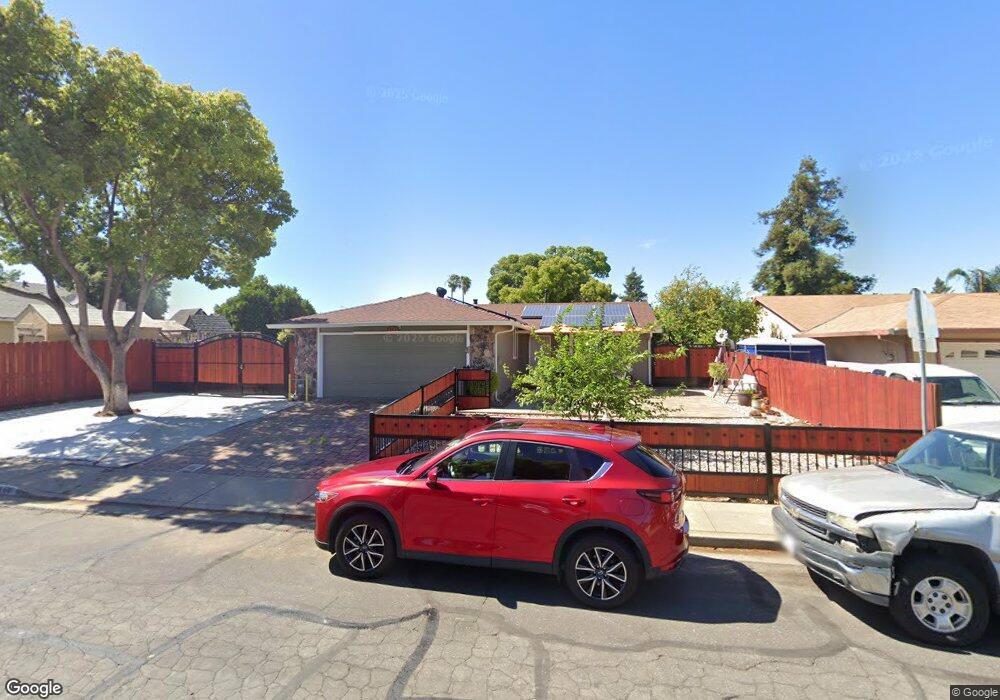
1748 Hanlon Way Pittsburg, CA 94565
Woodland Hills NeighborhoodEstimated Value: $453,000 - $486,000
2
Beds
1
Bath
792
Sq Ft
$586/Sq Ft
Est. Value
About This Home
This home is located at 1748 Hanlon Way, Pittsburg, CA 94565 and is currently estimated at $464,204, approximately $586 per square foot. 1748 Hanlon Way is a home located in Contra Costa County with nearby schools including Willow Cove Elementary School, Rancho Medanos Junior High School, and Pittsburg Senior High School.
Ownership History
Date
Name
Owned For
Owner Type
Purchase Details
Closed on
Mar 30, 2007
Sold by
Morales Jose W and Diaz Rosa
Bought by
Morales Jose W and Diaz Rosa
Current Estimated Value
Home Financials for this Owner
Home Financials are based on the most recent Mortgage that was taken out on this home.
Original Mortgage
$253,000
Outstanding Balance
$152,802
Interest Rate
6.13%
Mortgage Type
Stand Alone Refi Refinance Of Original Loan
Estimated Equity
$311,402
Purchase Details
Closed on
Aug 13, 2001
Sold by
Morales Jose W and Diaz Rosa
Bought by
Morales Jose W and Diaz Rosa
Home Financials for this Owner
Home Financials are based on the most recent Mortgage that was taken out on this home.
Original Mortgage
$188,339
Interest Rate
7.14%
Mortgage Type
FHA
Purchase Details
Closed on
Jun 25, 2001
Sold by
Skimski Paul A and Skimski Fern M
Bought by
Morales Jose W and Diaz Rosa
Home Financials for this Owner
Home Financials are based on the most recent Mortgage that was taken out on this home.
Original Mortgage
$188,339
Interest Rate
7.14%
Mortgage Type
FHA
Create a Home Valuation Report for This Property
The Home Valuation Report is an in-depth analysis detailing your home's value as well as a comparison with similar homes in the area
Home Values in the Area
Average Home Value in this Area
Purchase History
| Date | Buyer | Sale Price | Title Company |
|---|---|---|---|
| Morales Jose W | -- | United Title Company | |
| Morales Jose W | -- | Fidelity National Title Co | |
| Morales Jose W | $191,000 | Fidelity National Title Co |
Source: Public Records
Mortgage History
| Date | Status | Borrower | Loan Amount |
|---|---|---|---|
| Open | Morales Jose W | $253,000 | |
| Closed | Morales Jose W | $188,339 |
Source: Public Records
Tax History Compared to Growth
Tax History
| Year | Tax Paid | Tax Assessment Tax Assessment Total Assessment is a certain percentage of the fair market value that is determined by local assessors to be the total taxable value of land and additions on the property. | Land | Improvement |
|---|---|---|---|---|
| 2025 | $3,709 | $287,783 | $120,536 | $167,247 |
| 2024 | $3,758 | $282,141 | $118,173 | $163,968 |
| 2023 | $3,758 | $276,609 | $115,856 | $160,753 |
| 2022 | $3,808 | $271,186 | $113,585 | $157,601 |
| 2021 | $3,802 | $265,869 | $111,358 | $154,511 |
| 2019 | $3,619 | $257,985 | $108,056 | $149,929 |
| 2018 | $3,483 | $252,928 | $105,938 | $146,990 |
| 2017 | $3,455 | $247,969 | $103,861 | $144,108 |
| 2016 | $3,212 | $243,108 | $101,825 | $141,283 |
| 2015 | $3,209 | $227,500 | $95,288 | $132,212 |
| 2014 | $2,331 | $157,500 | $65,968 | $91,532 |
Source: Public Records
Map
Nearby Homes
- 7 Marlin Dr
- 26 Leeward Way
- 1813 Hanlon Way
- 97 E Trident Dr
- 113 E Trident Dr
- 61 Galleon Way
- 244 E Trident Dr
- 1526 Willow Pass Rd Unit 16
- 1526 Willow Pass Rd Unit 1
- 1526 Willow Pass Rd Unit 42
- 24 Mountain View Ave
- 0 Mountain View Ave
- 530 Michele Ct
- 68 - 76 Bayview Ave
- 818 Dobrich Cir
- 193 Maureen Cir
- 328 Snow Flake Way
- 79 Bella Vista Ave
- 171 Clipper Dr
- 93 La Habra
- 1742 Hanlon Way
- 187 W Trident Dr
- 195 W Trident Dr
- 175 W Trident Dr
- 1736 Hanlon Way
- 33 Nautilus Ct
- 163 W Trident Dr
- 27 Nautilus Ct
- 1751 Hanlon Way
- 1728 Hanlon Way
- 1757 Hanlon Way
- 1743 Hanlon Way
- 151 W Trident Dr
- 1765 Hanlon Way
- 1737 Hanlon Way
- 36 Nautilus Ct
- 1722 Hanlon Way
- 21 Nautilus Ct
- 182 W Trident Dr
- 1729 Hanlon Way