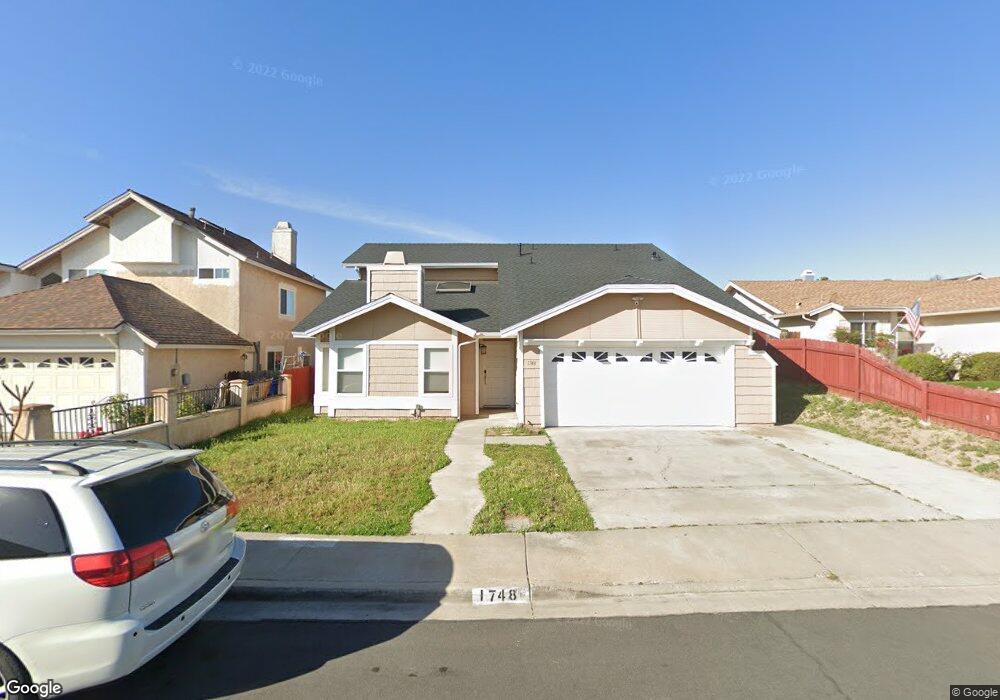
1748 Nilo Way San Diego, CA 92139
Bay Terraces NeighborhoodEstimated Value: $836,000 - $872,000
4
Beds
3
Baths
2,037
Sq Ft
$419/Sq Ft
Est. Value
About This Home
This home is located at 1748 Nilo Way, San Diego, CA 92139 and is currently estimated at $852,802, approximately $418 per square foot. 1748 Nilo Way is a home located in San Diego County with nearby schools including Zamorano Elementary School, Bell Middle School, and Morse High School.
Ownership History
Date
Name
Owned For
Owner Type
Purchase Details
Closed on
Jan 30, 2020
Sold by
Taing Saroeun
Bought by
Sim Sophia
Current Estimated Value
Home Financials for this Owner
Home Financials are based on the most recent Mortgage that was taken out on this home.
Original Mortgage
$450,000
Outstanding Balance
$399,498
Interest Rate
3.74%
Mortgage Type
New Conventional
Estimated Equity
$453,304
Purchase Details
Closed on
Jan 29, 2020
Sold by
Pham Johnny and Stone Ridge Triust
Bought by
Lay Sat Seima and Lay Judy Evelyn Ter
Home Financials for this Owner
Home Financials are based on the most recent Mortgage that was taken out on this home.
Original Mortgage
$450,000
Outstanding Balance
$399,498
Interest Rate
3.74%
Mortgage Type
New Conventional
Estimated Equity
$453,304
Purchase Details
Closed on
Nov 20, 2019
Sold by
Pham Johnny
Bought by
Pham Johnny and Stone Ridge Trust
Purchase Details
Closed on
Apr 13, 2018
Sold by
Lorio Joseph A
Bought by
Pham Johnny
Home Financials for this Owner
Home Financials are based on the most recent Mortgage that was taken out on this home.
Original Mortgage
$320,600
Interest Rate
4.46%
Mortgage Type
New Conventional
Purchase Details
Closed on
Nov 22, 1985
Bought by
Lorio Joseph A Aida R
Create a Home Valuation Report for This Property
The Home Valuation Report is an in-depth analysis detailing your home's value as well as a comparison with similar homes in the area
Home Values in the Area
Average Home Value in this Area
Purchase History
| Date | Buyer | Sale Price | Title Company |
|---|---|---|---|
| Sim Sophia | -- | Fidelity National Title | |
| Lay Sat Seima | $500,000 | Fidelity National Title | |
| Pham Johnny | -- | None Available | |
| Pham Johnny | $458,000 | California Title Company | |
| Lorio Joseph A Aida R | $118,000 | -- |
Source: Public Records
Mortgage History
| Date | Status | Borrower | Loan Amount |
|---|---|---|---|
| Open | Sim Sophia | $450,000 | |
| Previous Owner | Pham Johnny | $320,600 |
Source: Public Records
Tax History Compared to Growth
Tax History
| Year | Tax Paid | Tax Assessment Tax Assessment Total Assessment is a certain percentage of the fair market value that is determined by local assessors to be the total taxable value of land and additions on the property. | Land | Improvement |
|---|---|---|---|---|
| 2025 | $6,619 | $546,818 | $334,299 | $212,519 |
| 2024 | $6,619 | $536,097 | $327,745 | $208,352 |
| 2023 | $6,473 | $525,586 | $321,319 | $204,267 |
| 2022 | $6,301 | $515,281 | $315,019 | $200,262 |
| 2021 | $6,258 | $505,179 | $308,843 | $196,336 |
| 2020 | $5,893 | $476,503 | $291,312 | $185,191 |
| 2019 | $5,788 | $467,160 | $285,600 | $181,560 |
| 2018 | $2,479 | $215,249 | $58,620 | $156,629 |
| 2017 | $2,418 | $211,029 | $57,471 | $153,558 |
| 2016 | $2,377 | $206,893 | $56,345 | $150,548 |
| 2015 | $2,341 | $203,786 | $55,499 | $148,287 |
| 2014 | $2,303 | $199,795 | $54,412 | $145,383 |
Source: Public Records
Map
Nearby Homes
- 1882 Olamar Way
- 1865 Manzana Way
- 1481 Manzana Way
- 2920 Briarwood Rd Unit I1
- 2920 Briarwood Rd Unit K13
- 2920 Briarwood Rd
- 2920 Briarwood Rd Unit G11
- 3015 Plaza Leonardo
- 1153 Manzana Way
- 4849 Camino Roberto
- 3020 Plaza Lorenzo
- 275 S Worthington St Unit 105
- 275 S Worthington St Unit 124
- 275 S Worthington St Unit SPC 112
- 7483 Tooma St Unit B
- 7944 Tinaja Ln
- 7303 Gatewood Ln
- 530 Zest Ct
- 7856 Prairie Mound Way
- 2478 Manzana Way
- 1756 Nilo Way
- 1742 Nilo Way
- 1762 Nilo Way
- 1741 Shadewood Ln
- 1733 Shadewood Ln
- 1734 Nilo Way
- 1749 Shadewood Ln
- 1725 Shadewood Ln
- 1747 Nilo Way
- 1770 Nilo Way
- 1755 Nilo Way
- 1757 Shadewood Ln
- 1761 Nilo Way
- 1741 Nilo Way
- 1717 Shadewood Ln
- 1769 Nilo Way
- 1765 Shadewood Ln
- 1776 Nilo Way
- 1728 Nilo Way
- 1733 Nilo Way