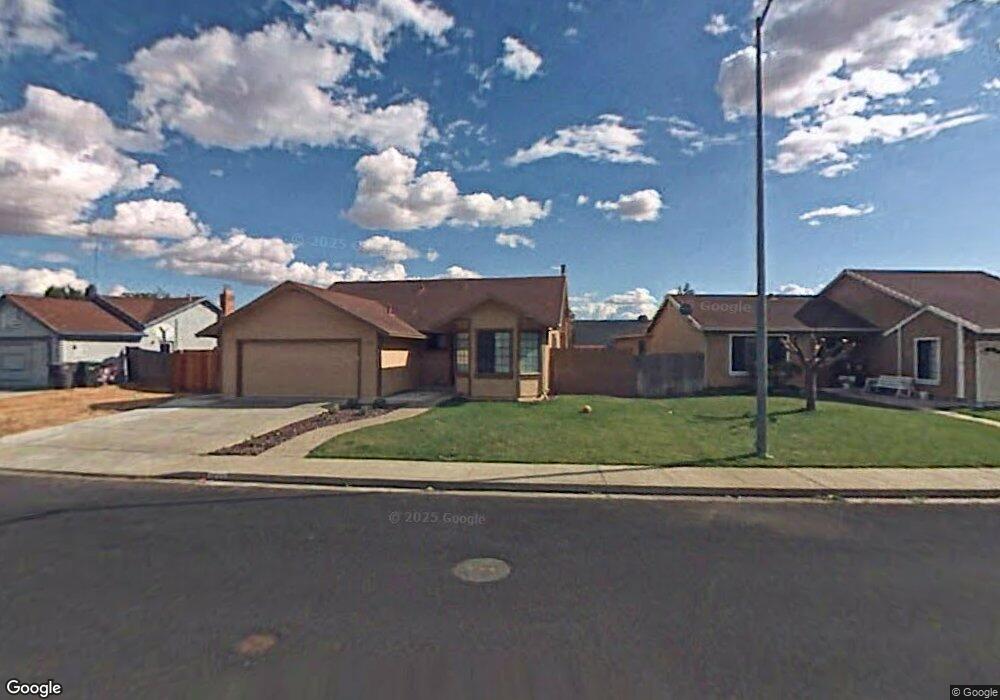
1748 Ventura Way Suisun City, CA 94585
Estimated Value: $517,000 - $559,000
3
Beds
2
Baths
1,434
Sq Ft
$373/Sq Ft
Est. Value
About This Home
This home is located at 1748 Ventura Way, Suisun City, CA 94585 and is currently estimated at $534,592, approximately $372 per square foot. 1748 Ventura Way is a home located in Solano County with nearby schools including Dan O. Root Elementary School, Crystal Middle School, and Armijo High School.
Ownership History
Date
Name
Owned For
Owner Type
Purchase Details
Closed on
May 7, 2012
Sold by
Federal Home Loan Mortgage Corporation
Bought by
Goltz Curtis and Goltz Dawna
Current Estimated Value
Home Financials for this Owner
Home Financials are based on the most recent Mortgage that was taken out on this home.
Original Mortgage
$190,421
Outstanding Balance
$132,180
Interest Rate
3.94%
Mortgage Type
FHA
Estimated Equity
$402,412
Purchase Details
Closed on
Feb 24, 2012
Sold by
Bohanon Felicia A
Bought by
Federal Home Loan Mortgage Corporation
Purchase Details
Closed on
Sep 1, 1998
Sold by
Moyle Joseph A and Moyle Denise L
Bought by
Bohanon Felicia A
Home Financials for this Owner
Home Financials are based on the most recent Mortgage that was taken out on this home.
Original Mortgage
$138,582
Interest Rate
6.93%
Mortgage Type
FHA
Create a Home Valuation Report for This Property
The Home Valuation Report is an in-depth analysis detailing your home's value as well as a comparison with similar homes in the area
Home Values in the Area
Average Home Value in this Area
Purchase History
| Date | Buyer | Sale Price | Title Company |
|---|---|---|---|
| Goltz Curtis | $180,000 | Lsi Title Company | |
| Federal Home Loan Mortgage Corporation | $128,400 | Accommodation | |
| Bohanon Felicia A | $140,000 | Placer Title Company |
Source: Public Records
Mortgage History
| Date | Status | Borrower | Loan Amount |
|---|---|---|---|
| Open | Goltz Curtis | $190,421 | |
| Previous Owner | Bohanon Felicia A | $138,582 |
Source: Public Records
Tax History Compared to Growth
Tax History
| Year | Tax Paid | Tax Assessment Tax Assessment Total Assessment is a certain percentage of the fair market value that is determined by local assessors to be the total taxable value of land and additions on the property. | Land | Improvement |
|---|---|---|---|---|
| 2025 | $2,696 | $226,077 | $50,235 | $175,842 |
| 2024 | $2,696 | $221,645 | $49,250 | $172,395 |
| 2023 | $2,617 | $217,300 | $48,285 | $169,015 |
| 2022 | $2,586 | $213,040 | $47,339 | $165,701 |
| 2021 | $2,561 | $208,863 | $46,411 | $162,452 |
| 2020 | $2,504 | $206,723 | $45,936 | $160,787 |
| 2019 | $2,444 | $202,671 | $45,036 | $157,635 |
| 2018 | $2,540 | $198,698 | $44,153 | $154,545 |
| 2017 | $2,431 | $194,803 | $43,288 | $151,515 |
| 2016 | $2,543 | $190,985 | $42,440 | $148,545 |
| 2015 | $2,541 | $188,117 | $41,803 | $146,314 |
| 2014 | $2,526 | $184,433 | $40,985 | $143,448 |
Source: Public Records
Map
Nearby Homes
- 1504 El Morro Ln
- 1201 Deanza Ct
- 1411 Klamath Dr
- 1415 Pelican Way
- 1651 Little Rock Cir
- 610 Placer Ln
- 1413 Spence Ct
- 1203 Heron Dr
- 819 Bluejay Dr
- 1109 Canary Dr
- 401 Donaldson Ct
- 607 Crested Dr
- 1665 Youngstown Ln
- 330 Engell Ct
- 1023 Pintail Dr
- 2084 Parsons Dr
- 1280 Mayfield Cir
- 301 Childs Ct
- 51 Barcelona Cir
- 1016 Prairie Dr