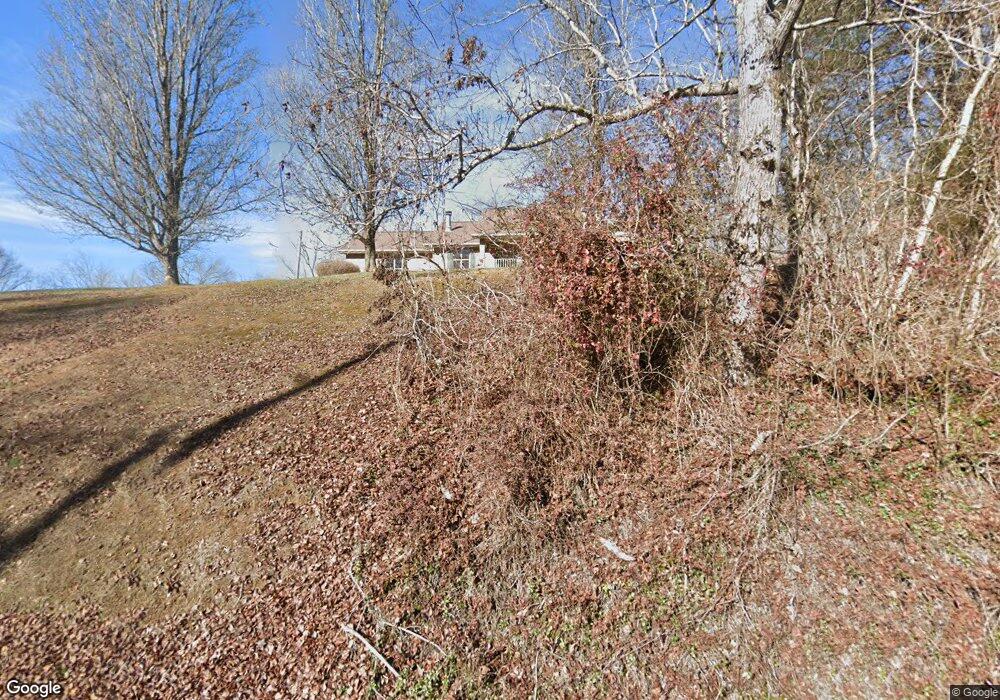
1749 Dupont Rd Seymour, TN 37865
Estimated Value: $273,000 - $287,186
--
Bed
2
Baths
1,505
Sq Ft
$186/Sq Ft
Est. Value
About This Home
This home is located at 1749 Dupont Rd, Seymour, TN 37865 and is currently estimated at $280,093, approximately $186 per square foot. 1749 Dupont Rd is a home located in Sevier County with nearby schools including Northview Elementary School, Catons Chapel Elementary School, and Jones Cove Elementary School.
Ownership History
Date
Name
Owned For
Owner Type
Purchase Details
Closed on
Sep 16, 2025
Sold by
Moorefield Paige Burchell
Bought by
Stalans Sheri L
Current Estimated Value
Purchase Details
Closed on
Jul 14, 2025
Sold by
Stalans Ruby and Stalans Ruby L
Bought by
Moorefield Paige Burchell
Purchase Details
Closed on
Aug 7, 2000
Sold by
Larry Burchell
Bought by
Stalans Jay H
Purchase Details
Closed on
Aug 3, 2000
Sold by
Larry Burchell
Bought by
Larry Burchell
Purchase Details
Closed on
Jun 17, 2000
Sold by
Larry Burchell
Bought by
United Companies Lending
Purchase Details
Closed on
May 2, 1995
Sold by
Darius Foran
Bought by
Lee Foran Darius
Purchase Details
Closed on
Dec 29, 1992
Bought by
Foran Darius and Foran Lucy
Purchase Details
Closed on
Sep 4, 1991
Bought by
Loveday Gary M
Create a Home Valuation Report for This Property
The Home Valuation Report is an in-depth analysis detailing your home's value as well as a comparison with similar homes in the area
Home Values in the Area
Average Home Value in this Area
Purchase History
| Date | Buyer | Sale Price | Title Company |
|---|---|---|---|
| Stalans Sheri L | $168,500 | Tennessee Land Title | |
| Moorefield Paige Burchell | -- | Tennessee Land Title | |
| Moorefield Paige Burchell | -- | Tennessee Land Title | |
| Stalans Jay H | -- | -- | |
| Larry Burchell | $20,000 | -- | |
| United Companies Lending | $24,000 | -- | |
| Lee Foran Darius | -- | -- | |
| Foran Darius | $19,000 | -- | |
| Loveday Gary M | $6,000 | -- |
Source: Public Records
Tax History Compared to Growth
Tax History
| Year | Tax Paid | Tax Assessment Tax Assessment Total Assessment is a certain percentage of the fair market value that is determined by local assessors to be the total taxable value of land and additions on the property. | Land | Improvement |
|---|---|---|---|---|
| 2025 | $623 | $42,125 | $6,475 | $35,650 |
| 2024 | $623 | $42,125 | $6,475 | $35,650 |
| 2023 | $623 | $42,125 | $0 | $0 |
| 2022 | $623 | $42,125 | $6,475 | $35,650 |
| 2021 | $623 | $42,125 | $6,475 | $35,650 |
| 2020 | $643 | $42,125 | $6,475 | $35,650 |
| 2019 | $643 | $34,575 | $6,550 | $28,025 |
| 2018 | $643 | $34,575 | $6,550 | $28,025 |
| 2017 | $643 | $34,575 | $6,550 | $28,025 |
| 2016 | $643 | $34,575 | $6,550 | $28,025 |
| 2015 | -- | $35,750 | $0 | $0 |
| 2014 | $582 | $35,735 | $0 | $0 |
Source: Public Records
Map
Nearby Homes
- 0 Reagan Springs Rd Unit 307121
- 0 Reagan Springs Rd Unit 1306115
- 0 Dupont Rd Unit 704435
- 0 Dupont Rd Unit 302113
- 0 Dupont Rd Unit 1269924
- 1868 S Delozier Rd
- 1053 Reagan Springs Rd
- 1582 Hawk Ln
- 1566 Hawk Ln
- 1419 S Delozier Rd
- 772 Goose Creek Rd Unit 766
- 1015 Ruff Grouse Way
- 0 Prettiest Sunset Way Unit 1306272
- 1313 Dupont Rd
- 0 S Rogers Rd Unit 1305124
- 1549 Prettiest Sunset Way
- Lot S Rogers Rd
- Tract 2 Wye Dr
- 0 Prettiest Sunset Lot #5 Way
- Tract 3 Wye Dr
- 1807 Dupont Rd
- 706 Reagan Springs Rd
- 1740 Dupont Rd
- 705 Reagan Springs Rd
- 712 Reagan Springs Rd
- 1723 Dupont Rd
- 718 Reagan Springs Rd
- 722 Reagan Springs Rd
- 1823 Dupont Rd
- 1813 Dupont Rd
- 1814 Dupont Rd
- 1659 Dupont Rd
- 711 Reagan Springs Rd
- 1833 Dupont Rd
- 1726 Dupont Rd
- 1661 Dupont Rd
- 737 Reagan Springs Rd
- 746 Reagan Springs Rd
- 755 Reagan Springs Rd
- 2429 Dripping Springs Rd