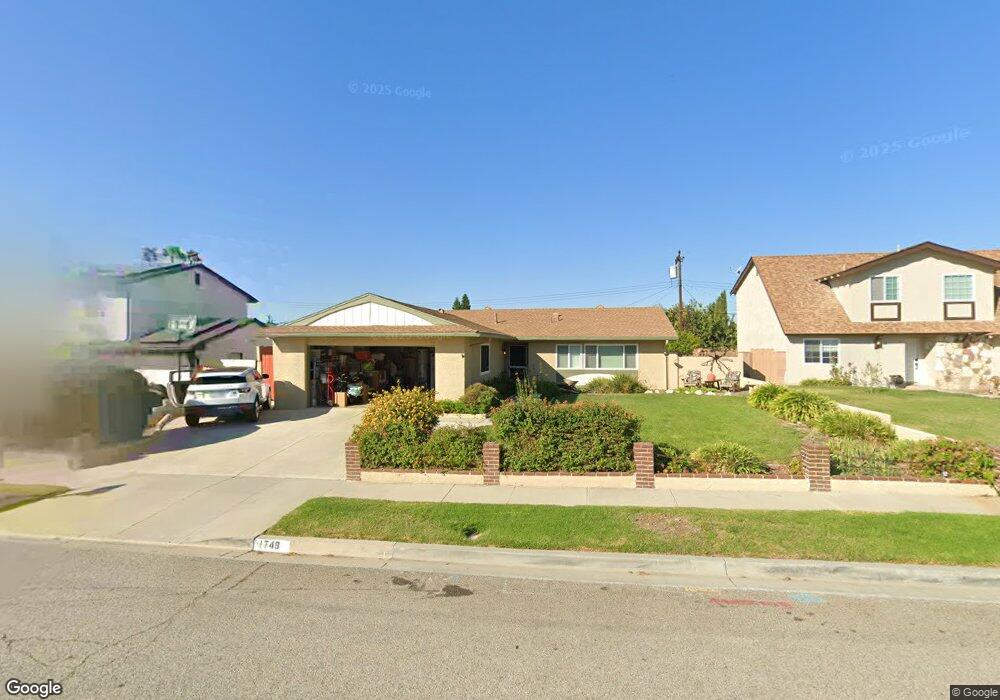
1749 Lydia Cir Simi Valley, CA 93065
Central Simi Valley NeighborhoodEstimated Value: $751,362 - $786,000
3
Beds
2
Baths
1,205
Sq Ft
$637/Sq Ft
Est. Value
About This Home
This home is located at 1749 Lydia Cir, Simi Valley, CA 93065 and is currently estimated at $767,091, approximately $636 per square foot. 1749 Lydia Cir is a home located in Ventura County with nearby schools including Berylwood Elementary School, Hillside Middle School, and Royal High School.
Ownership History
Date
Name
Owned For
Owner Type
Purchase Details
Closed on
Nov 12, 2024
Sold by
Harper Donna Marie
Bought by
Donna Harper Trust and Harper
Current Estimated Value
Purchase Details
Closed on
Oct 16, 2020
Sold by
Robbie Kinue and Robbie David L
Bought by
Harper Donna Marie
Purchase Details
Closed on
Aug 29, 2002
Sold by
Robbie David
Bought by
Robbie David L and Robbie Kinue
Create a Home Valuation Report for This Property
The Home Valuation Report is an in-depth analysis detailing your home's value as well as a comparison with similar homes in the area
Home Values in the Area
Average Home Value in this Area
Purchase History
| Date | Buyer | Sale Price | Title Company |
|---|---|---|---|
| Donna Harper Trust | -- | None Listed On Document | |
| Donna Harper Trust | -- | None Listed On Document | |
| Harper Donna Marie | -- | None Available | |
| Robbie David L | -- | -- |
Source: Public Records
Tax History Compared to Growth
Tax History
| Year | Tax Paid | Tax Assessment Tax Assessment Total Assessment is a certain percentage of the fair market value that is determined by local assessors to be the total taxable value of land and additions on the property. | Land | Improvement |
|---|---|---|---|---|
| 2025 | $1,386 | $64,859 | $19,555 | $45,304 |
| 2024 | $1,386 | $63,588 | $19,172 | $44,416 |
| 2023 | $1,298 | $62,342 | $18,796 | $43,546 |
| 2022 | $1,252 | $61,120 | $18,427 | $42,693 |
| 2021 | $1,206 | $59,922 | $18,066 | $41,856 |
| 2020 | $1,234 | $59,310 | $17,882 | $41,428 |
| 2019 | $1,173 | $58,148 | $17,532 | $40,616 |
| 2018 | $1,140 | $57,009 | $17,189 | $39,820 |
| 2017 | $1,098 | $55,892 | $16,852 | $39,040 |
| 2016 | $1,041 | $54,797 | $16,522 | $38,275 |
| 2015 | $1,000 | $53,976 | $16,275 | $37,701 |
| 2014 | $965 | $52,920 | $15,957 | $36,963 |
Source: Public Records
Map
Nearby Homes
- 1948 Heywood St Unit L
- 1932 Heywood St Unit B
- 2095 Morley St
- 1755 Heywood St Unit 203
- 1740 Heywood St
- 2091 Marter Ave
- 2146 N Brower St
- 1886 Cloud Ct
- 2241 Burnside St
- 1882 Larch St
- 2025 Royal Ave
- 2368 Heywood St
- 1858 Sutter Ave
- 2239 McDonald St
- 1290 Lawrence Cir
- 1277 Erringer Rd
- 2405 Lee St
- 1748 Sutter Ave
- 2349 Knollhaven St
- 2266 Lansdale Ct