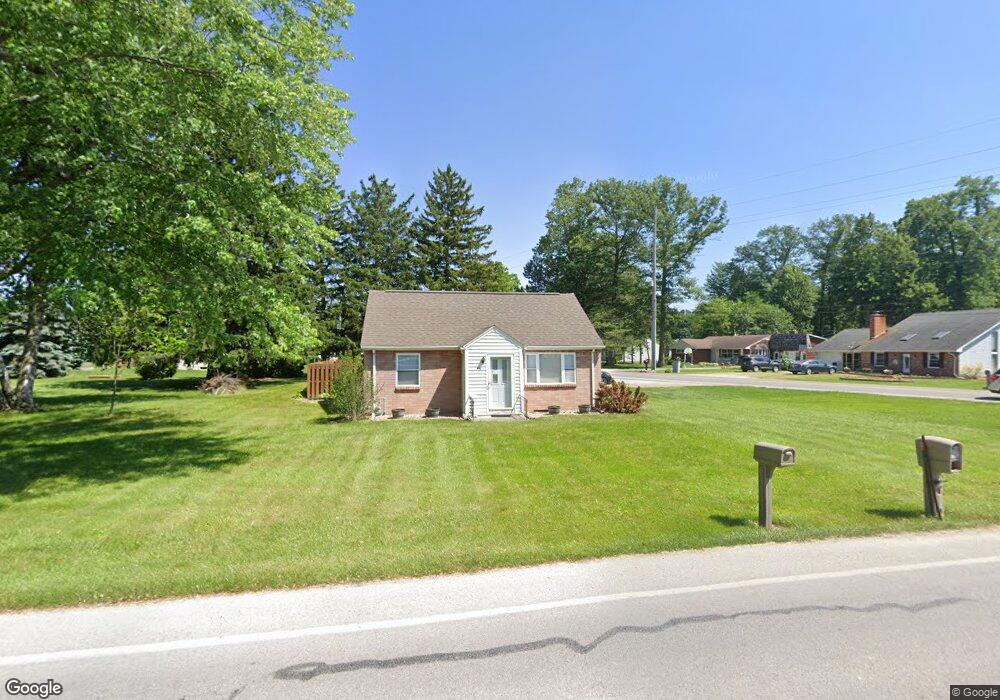
1749 Morrison Rd Fremont, OH 43420
Estimated Value: $121,414 - $221,000
2
Beds
1
Bath
750
Sq Ft
$220/Sq Ft
Est. Value
About This Home
This home is located at 1749 Morrison Rd, Fremont, OH 43420 and is currently estimated at $165,104, approximately $220 per square foot. 1749 Morrison Rd is a home located in Sandusky County with nearby schools including Fremont Ross High School, Sacred Heart School, and St. Joseph School.
Ownership History
Date
Name
Owned For
Owner Type
Purchase Details
Closed on
May 8, 2002
Sold by
Wonderly Sharon K
Bought by
Pitchford Michael G and Pitchford Debra A
Current Estimated Value
Home Financials for this Owner
Home Financials are based on the most recent Mortgage that was taken out on this home.
Original Mortgage
$75,905
Outstanding Balance
$32,750
Interest Rate
7.24%
Mortgage Type
New Conventional
Estimated Equity
$132,354
Purchase Details
Closed on
Feb 1, 1992
Bought by
Pitchford Michael G and Pitchford Debra A
Create a Home Valuation Report for This Property
The Home Valuation Report is an in-depth analysis detailing your home's value as well as a comparison with similar homes in the area
Home Values in the Area
Average Home Value in this Area
Purchase History
| Date | Buyer | Sale Price | Title Company |
|---|---|---|---|
| Pitchford Michael G | $79,900 | -- | |
| Pitchford Michael G | $50,000 | -- |
Source: Public Records
Mortgage History
| Date | Status | Borrower | Loan Amount |
|---|---|---|---|
| Open | Pitchford Michael G | $75,905 |
Source: Public Records
Tax History Compared to Growth
Tax History
| Year | Tax Paid | Tax Assessment Tax Assessment Total Assessment is a certain percentage of the fair market value that is determined by local assessors to be the total taxable value of land and additions on the property. | Land | Improvement |
|---|---|---|---|---|
| 2024 | $1,577 | $40,570 | $14,700 | $25,870 |
| 2023 | $1,577 | $28,390 | $10,290 | $18,100 |
| 2022 | $1,178 | $33,500 | $10,290 | $23,210 |
| 2021 | $1,433 | $33,500 | $10,290 | $23,210 |
| 2020 | $1,296 | $29,720 | $10,290 | $19,430 |
| 2019 | $1,295 | $29,720 | $10,290 | $19,430 |
| 2018 | $1,210 | $29,720 | $10,290 | $19,430 |
| 2017 | $1,159 | $27,200 | $10,290 | $16,910 |
| 2016 | $1,016 | $27,200 | $10,290 | $16,910 |
| 2015 | $1,000 | $27,200 | $10,290 | $16,910 |
| 2014 | $994 | $25,910 | $10,260 | $15,650 |
| 2013 | $973 | $25,910 | $10,260 | $15,650 |
Source: Public Records
Map
Nearby Homes
- 1832 Myrtle St
- 933 E Cole Rd
- 18 Katlyn Dr
- 1818 Finley Dr
- 1970 Morrison Rd
- 350 Conner Dr
- 135 Briarwood Cir
- 41 Brookview Dr
- 64 River Run Dr Unit J
- 10 Meadowbrook Ln
- 10 Meadowbrook Dr
- 1420 Center St
- 1013 Whittlesey St
- 905 Twinn St
- 625 Bush Place
- 600 S Buchanan St
- 815 South St
- 0 S Buchanan St
- 1028 June St
- 1485 Autumn Woods Dr
- 1758 Morrison Rd
- 650 E Cole Rd
- 535 E Cole Rd
- 607 E Cole Rd
- 1744 Morrison Rd
- 521 E Cole Rd
- 1736 Morrison Rd
- 613 E Cole Rd
- 510 E Cole Rd
- 1729 Morrison Rd
- 692 E Cole Rd
- 100 Springbrook Dr
- 1724 Morrison Rd
- 1813 Morrison Rd
- 500 E Cole Rd
- 1719 Morrison Rd
- 1722 Morrison Rd
- 701 E Cole Rd
- 1829 Morrison Rd
- 104 Springbrook Dr