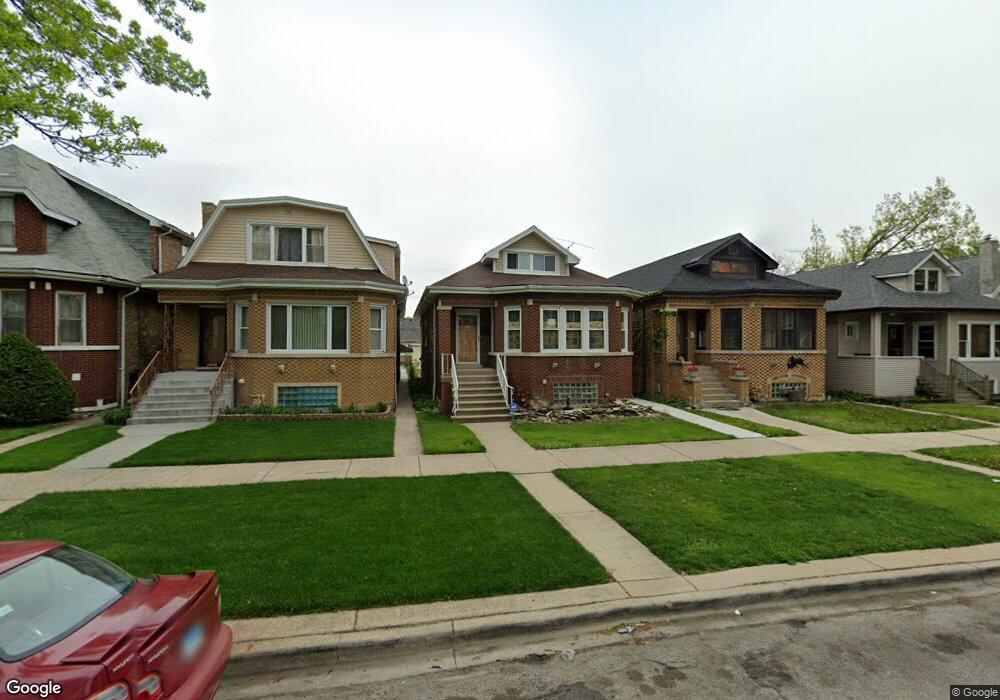
1749 N Nagle Ave Chicago, IL 60707
Galewood NeighborhoodEstimated Value: $360,000 - $431,000
3
Beds
2
Baths
1,306
Sq Ft
$310/Sq Ft
Est. Value
About This Home
This home is located at 1749 N Nagle Ave, Chicago, IL 60707 and is currently estimated at $404,385, approximately $309 per square foot. 1749 N Nagle Ave is a home located in Cook County with nearby schools including Lovett Elementary School, Steinmetz College Prep, and Acero - Roberto Clemente Elementary School.
Ownership History
Date
Name
Owned For
Owner Type
Purchase Details
Closed on
Nov 28, 2017
Sold by
Robles Anna Lisette and Robles Juan G
Bought by
Kelton Josephine
Current Estimated Value
Home Financials for this Owner
Home Financials are based on the most recent Mortgage that was taken out on this home.
Original Mortgage
$372,099
Outstanding Balance
$317,693
Interest Rate
4.5%
Mortgage Type
FHA
Estimated Equity
$86,692
Purchase Details
Closed on
Sep 26, 2005
Sold by
Ogrodny Marek and Ogrodny Justyna
Bought by
Robles Juan G
Home Financials for this Owner
Home Financials are based on the most recent Mortgage that was taken out on this home.
Original Mortgage
$282,400
Interest Rate
7.85%
Mortgage Type
Unknown
Purchase Details
Closed on
Mar 30, 2005
Sold by
Simane Leo W and Simane Riva
Bought by
Ogrodny Marek and Ogrodny Justyna
Home Financials for this Owner
Home Financials are based on the most recent Mortgage that was taken out on this home.
Original Mortgage
$216,700
Interest Rate
5.87%
Mortgage Type
New Conventional
Create a Home Valuation Report for This Property
The Home Valuation Report is an in-depth analysis detailing your home's value as well as a comparison with similar homes in the area
Home Values in the Area
Average Home Value in this Area
Purchase History
| Date | Buyer | Sale Price | Title Company |
|---|---|---|---|
| Kelton Josephine | $286,500 | Attorneys Title Guaranty Fun | |
| Robles Juan G | $353,000 | Marquis Title Insurance Co | |
| Ogrodny Marek | $241,000 | Pntn |
Source: Public Records
Mortgage History
| Date | Status | Borrower | Loan Amount |
|---|---|---|---|
| Open | Kelton Josephine | $372,099 | |
| Previous Owner | Robles Juan G | $282,400 | |
| Previous Owner | Ogrodny Marek | $216,700 |
Source: Public Records
Tax History Compared to Growth
Tax History
| Year | Tax Paid | Tax Assessment Tax Assessment Total Assessment is a certain percentage of the fair market value that is determined by local assessors to be the total taxable value of land and additions on the property. | Land | Improvement |
|---|---|---|---|---|
| 2024 | $4,578 | $38,288 | $16,089 | $22,199 |
| 2023 | $4,441 | $28,751 | $12,838 | $15,913 |
| 2022 | $4,441 | $28,751 | $12,838 | $15,913 |
| 2021 | $4,361 | $25,002 | $12,840 | $12,162 |
| 2020 | $5,760 | $28,945 | $6,487 | $22,458 |
| 2019 | $5,849 | $32,523 | $6,487 | $26,036 |
| 2018 | $3,945 | $23,397 | $6,487 | $16,910 |
| 2017 | $4,190 | $22,827 | $5,709 | $17,118 |
| 2016 | $4,074 | $22,827 | $5,709 | $17,118 |
| 2015 | $3,704 | $22,827 | $5,709 | $17,118 |
| 2014 | $3,253 | $20,086 | $5,190 | $14,896 |
| 2013 | $3,177 | $20,086 | $5,190 | $14,896 |
Source: Public Records
Map
Nearby Homes
- 1627 N Narragansett Ave
- 1700 N Natoma Ave
- 1221 Edmer Ave
- 1639 N Normandy Ave
- 1227 N East Ave
- 1212 N Harvey Ave
- 1937 N Normandy Ave
- 1122 N Ridgeland Ave
- 1221 Hayes Ave
- 1733 N Oak Park Ave
- 1104 Fair Oaks Ave
- 1715 N Meade Ave
- 102 Le Moyne Pkwy
- 1618 N Mcvicker Ave
- 1625 N Mcvicker Ave
- 34 Le Moyne Pkwy
- 1115 N Taylor Ave
- 1657 N Austin Ave
- 1003 Mapleton Ave
- 1600 N New England Ave Unit 4
- 1747 N Nagle Ave
- 1751 N Nagle Ave
- 1755 N Nagle Ave
- 1743 N Nagle Ave
- 6423 W Bloomingdale Ave Unit 1REAR
- 1741 N Nagle Ave
- 1737 N Nagle Ave
- 1735 N Nagle Ave
- 1731 N Nagle Ave
- 1801 N Nagle Ave
- 1744 N Narragansett Ave
- 1740 N Narragansett Ave
- 1729 N Nagle Ave
- 1805 N Nagle Ave
- 1738 N Narragansett Ave
- 6414 W Bloomingdale Ave
- 1734 N Narragansett Ave
- 1807 N Nagle Ave
- 1725 N Nagle Ave
- 1748 N Nagle Ave