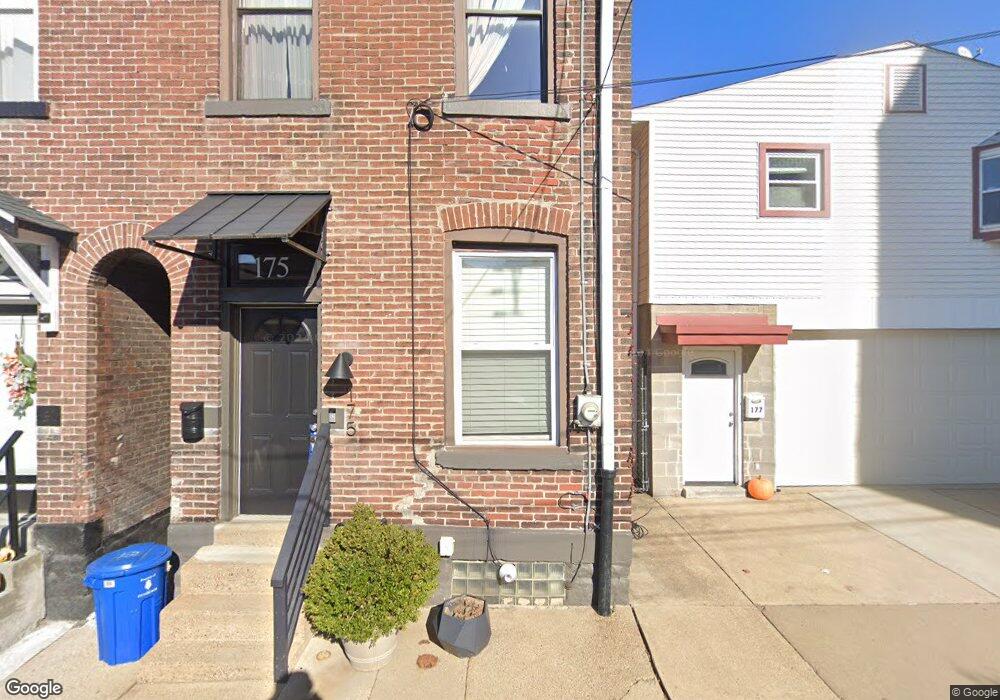
175 Banner Way Pittsburgh, PA 15201
Central Lawrenceville NeighborhoodEstimated Value: $264,000 - $326,000
2
Beds
1
Bath
957
Sq Ft
$305/Sq Ft
Est. Value
About This Home
This home is located at 175 Banner Way, Pittsburgh, PA 15201 and is currently estimated at $291,997, approximately $305 per square foot. 175 Banner Way is a home located in Allegheny County with nearby schools including Pittsburgh Arsenal 6-8, Pittsburgh Arsenal K-5, and Pittsburgh Milliones 6-12.
Ownership History
Date
Name
Owned For
Owner Type
Purchase Details
Closed on
Jun 21, 2021
Sold by
Wylie Holdings Lp
Bought by
Smith Alaina Anne
Current Estimated Value
Home Financials for this Owner
Home Financials are based on the most recent Mortgage that was taken out on this home.
Original Mortgage
$249,775
Outstanding Balance
$226,140
Interest Rate
2.9%
Mortgage Type
New Conventional
Estimated Equity
$65,857
Purchase Details
Closed on
Jun 5, 2012
Sold by
South Philadelphia H O M E S I
Bought by
Wylie Holdings L P
Purchase Details
Closed on
Jan 3, 2012
Sold by
Bafc 2007 1 By Trste
Bought by
South Philadelphia H O M E S I
Purchase Details
Closed on
Apr 4, 2011
Sold by
Moore Pressley Shawnece
Bought by
B A F C 2007 1 By Trste and U S Bank N A Trste
Create a Home Valuation Report for This Property
The Home Valuation Report is an in-depth analysis detailing your home's value as well as a comparison with similar homes in the area
Home Values in the Area
Average Home Value in this Area
Purchase History
| Date | Buyer | Sale Price | Title Company |
|---|---|---|---|
| Smith Alaina Anne | $257,500 | -- | |
| Smith Alaina Anne | $257,500 | Signature Settlement Svcs | |
| Wylie Holdings L P | $20,000 | -- | |
| South Philadelphia H O M E S I | $25,506 | -- | |
| B A F C 2007 1 By Trste | -- | -- |
Source: Public Records
Mortgage History
| Date | Status | Borrower | Loan Amount |
|---|---|---|---|
| Open | Smith Alaina Anne | $249,775 |
Source: Public Records
Tax History Compared to Growth
Tax History
| Year | Tax Paid | Tax Assessment Tax Assessment Total Assessment is a certain percentage of the fair market value that is determined by local assessors to be the total taxable value of land and additions on the property. | Land | Improvement |
|---|---|---|---|---|
| 2025 | $46 | $2,000 | $2,000 | -- |
| 2024 | $46 | $2,000 | $2,000 | -- |
| 2023 | $46 | $2,000 | $2,000 | $0 |
| 2022 | $455 | $2,000 | $2,000 | $0 |
| 2021 | $455 | $20,000 | $5,000 | $15,000 |
| 2020 | $453 | $20,000 | $5,000 | $15,000 |
| 2019 | $453 | $20,000 | $5,000 | $15,000 |
| 2018 | $95 | $20,000 | $5,000 | $15,000 |
| 2017 | $453 | $20,000 | $5,000 | $15,000 |
| 2016 | $95 | $20,000 | $5,000 | $15,000 |
| 2015 | $95 | $20,000 | $5,000 | $15,000 |
| 2014 | -- | $20,000 | $5,000 | $15,000 |
Source: Public Records
Map
Nearby Homes