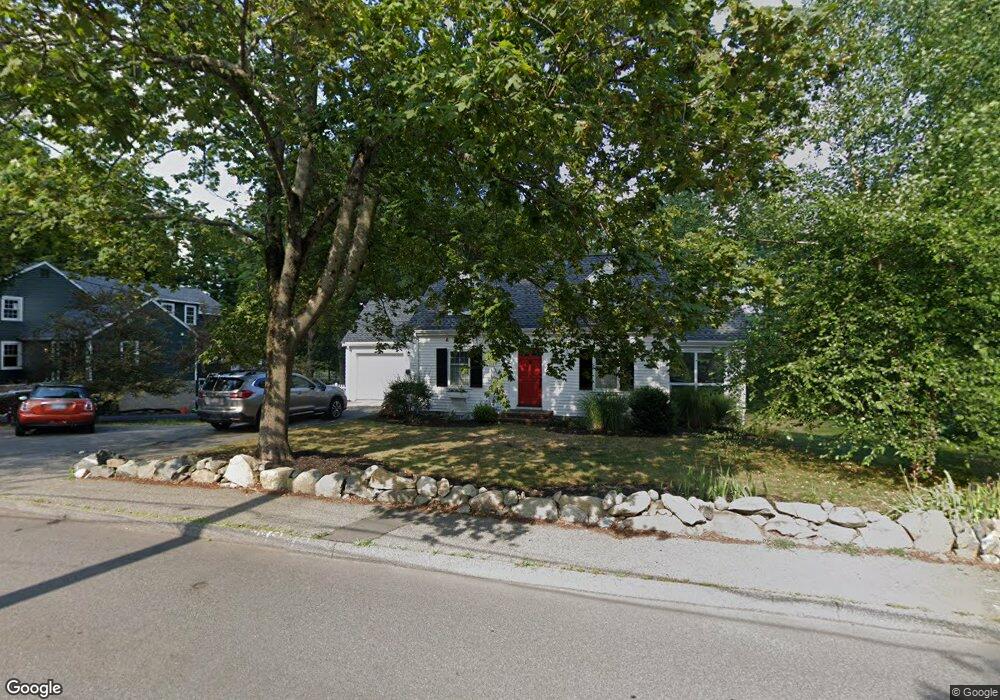
175 Chestnut St Lynnfield, MA 01940
Estimated Value: $804,559 - $999,000
2
Beds
2
Baths
1,404
Sq Ft
$644/Sq Ft
Est. Value
About This Home
This home is located at 175 Chestnut St, Lynnfield, MA 01940 and is currently estimated at $903,640, approximately $643 per square foot. 175 Chestnut St is a home located in Essex County with nearby schools including Lynnfield Middle School, Lynnfield High School, and Odyssey Day School.
Ownership History
Date
Name
Owned For
Owner Type
Purchase Details
Closed on
Nov 28, 2011
Sold by
Duggan Patricia
Bought by
Duggan Patricia and Zuercher Michael F
Current Estimated Value
Home Financials for this Owner
Home Financials are based on the most recent Mortgage that was taken out on this home.
Original Mortgage
$412,243
Outstanding Balance
$283,487
Interest Rate
4.12%
Mortgage Type
FHA
Estimated Equity
$620,153
Purchase Details
Closed on
Aug 27, 2009
Sold by
Burns Amy and Woods Jeffrey G
Bought by
Duggan Patricia
Home Financials for this Owner
Home Financials are based on the most recent Mortgage that was taken out on this home.
Original Mortgage
$421,351
Interest Rate
5.17%
Mortgage Type
Purchase Money Mortgage
Purchase Details
Closed on
Apr 28, 2003
Sold by
Frisone John A and Jurewicz Marc E
Bought by
Burns Amy
Home Financials for this Owner
Home Financials are based on the most recent Mortgage that was taken out on this home.
Original Mortgage
$210,000
Interest Rate
5.64%
Mortgage Type
Purchase Money Mortgage
Purchase Details
Closed on
Dec 5, 2000
Sold by
Mcgarry Emily L
Bought by
Frisone John A and Jurewicz Marc E
Home Financials for this Owner
Home Financials are based on the most recent Mortgage that was taken out on this home.
Original Mortgage
$180,000
Interest Rate
7.76%
Mortgage Type
Purchase Money Mortgage
Create a Home Valuation Report for This Property
The Home Valuation Report is an in-depth analysis detailing your home's value as well as a comparison with similar homes in the area
Home Values in the Area
Average Home Value in this Area
Purchase History
| Date | Buyer | Sale Price | Title Company |
|---|---|---|---|
| Duggan Patricia | -- | -- | |
| Duggan Patricia | $435,900 | -- | |
| Burns Amy | $410,000 | -- | |
| Frisone John A | $345,000 | -- |
Source: Public Records
Mortgage History
| Date | Status | Borrower | Loan Amount |
|---|---|---|---|
| Open | Frisone John A | $412,243 | |
| Previous Owner | Frisone John A | $421,351 | |
| Previous Owner | Frisone John A | $210,000 | |
| Previous Owner | Frisone John A | $180,000 |
Source: Public Records
Tax History
| Year | Tax Paid | Tax Assessment Tax Assessment Total Assessment is a certain percentage of the fair market value that is determined by local assessors to be the total taxable value of land and additions on the property. | Land | Improvement |
|---|---|---|---|---|
| 2025 | $8,376 | $793,200 | $582,400 | $210,800 |
| 2024 | $8,214 | $781,500 | $573,800 | $207,700 |
| 2023 | $7,694 | $680,900 | $493,800 | $187,100 |
| 2022 | $7,548 | $629,500 | $468,400 | $161,100 |
| 2021 | $7,172 | $540,500 | $390,300 | $150,200 |
| 2020 | $6,698 | $481,200 | $331,000 | $150,200 |
| 2019 | $6,433 | $462,500 | $312,300 | $150,200 |
| 2018 | $6,364 | $462,500 | $312,300 | $150,200 |
| 2017 | $6,103 | $442,900 | $292,700 | $150,200 |
| 2016 | $6,338 | $437,100 | $286,900 | $150,200 |
| 2015 | $6,322 | $436,300 | $286,100 | $150,200 |
Source: Public Records
Map
Nearby Homes