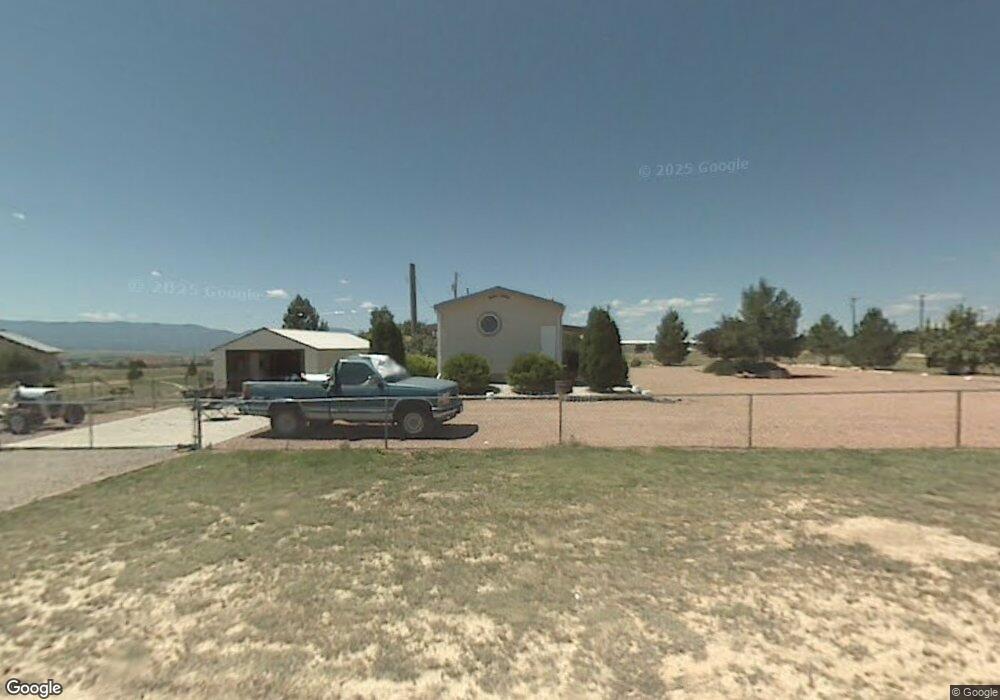
175 Dawson St Penrose, CO 81240
Estimated Value: $240,000 - $440,000
3
Beds
2
Baths
1,216
Sq Ft
$285/Sq Ft
Est. Value
About This Home
This home is located at 175 Dawson St, Penrose, CO 81240 and is currently estimated at $346,333, approximately $284 per square foot. 175 Dawson St is a home located in Fremont County with nearby schools including Penrose Elementary School and Florence High School.
Ownership History
Date
Name
Owned For
Owner Type
Purchase Details
Closed on
Dec 3, 2012
Sold by
Chavez Celeste M
Bought by
Main Darrel L
Current Estimated Value
Purchase Details
Closed on
Nov 10, 2009
Sold by
Secretary Of Housing & Urban Development
Bought by
Main Darrel L and Chavez Celeste M
Purchase Details
Closed on
Aug 18, 2009
Sold by
Mcfarland Patricia A
Bought by
Secretary Of Housing & Urban Development
Purchase Details
Closed on
Aug 25, 2006
Sold by
Grisenti Christiane and Kale Russ Ann
Bought by
Grisenti Christiane
Create a Home Valuation Report for This Property
The Home Valuation Report is an in-depth analysis detailing your home's value as well as a comparison with similar homes in the area
Home Values in the Area
Average Home Value in this Area
Purchase History
| Date | Buyer | Sale Price | Title Company |
|---|---|---|---|
| Main Darrel L | -- | None Available | |
| Main Darrel L | $60,000 | Wtg | |
| Secretary Of Housing & Urban Development | -- | None Available | |
| Grisenti Christiane | -- | Security Title |
Source: Public Records
Tax History Compared to Growth
Tax History
| Year | Tax Paid | Tax Assessment Tax Assessment Total Assessment is a certain percentage of the fair market value that is determined by local assessors to be the total taxable value of land and additions on the property. | Land | Improvement |
|---|---|---|---|---|
| 2024 | $1,244 | $21,021 | $0 | $0 |
| 2023 | $1,244 | $19,872 | $0 | $0 |
| 2022 | $778 | $10,749 | $0 | $0 |
| 2021 | $788 | $11,058 | $0 | $0 |
| 2020 | $531 | $8,708 | $0 | $0 |
| 2019 | $533 | $8,708 | $0 | $0 |
| 2018 | $441 | $7,225 | $0 | $0 |
| 2017 | $449 | $7,225 | $0 | $0 |
| 2016 | $480 | $7,840 | $0 | $0 |
| 2015 | $474 | $7,840 | $0 | $0 |
| 2012 | $497 | $7,574 | $2,786 | $4,788 |
Source: Public Records
Map
Nearby Homes