Estimated Value: $2,051,736 - $2,539,000
4
Beds
4
Baths
3,704
Sq Ft
$608/Sq Ft
Est. Value
About This Home
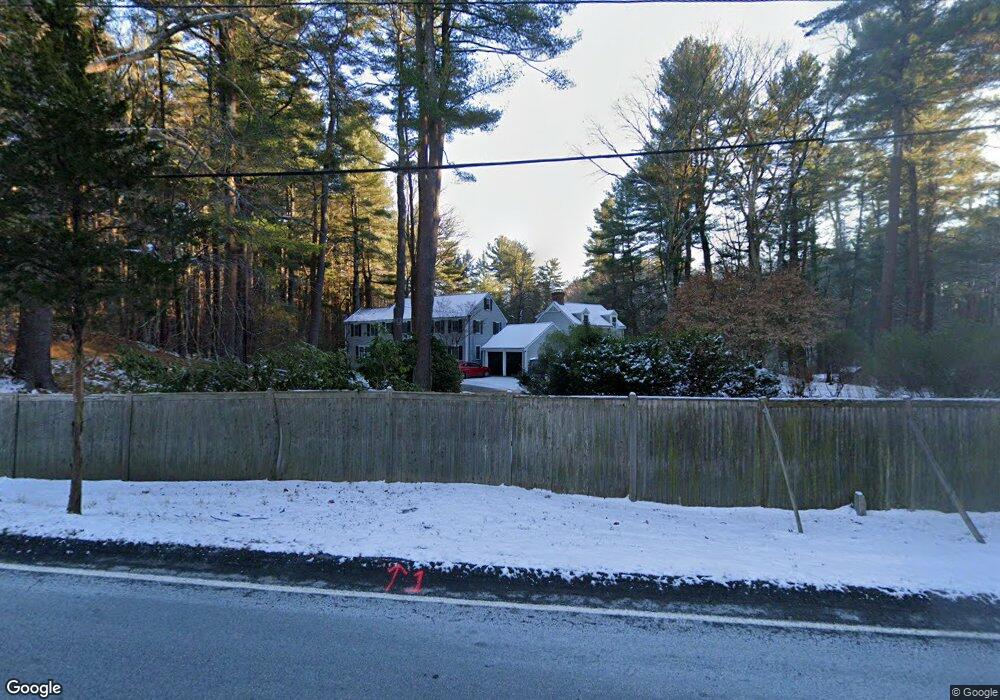
This home is located at 175 Dedham St, Dover, MA 02030 and is currently estimated at $2,250,434, approximately $607 per square foot. 175 Dedham St is a home located in Norfolk County with nearby schools including Chickering Elementary School, Dover-Sherborn Regional Middle School, and Dover-Sherborn Regional High School.
Ownership History
Date
Name
Owned For
Owner Type
Purchase Details
Closed on
Aug 27, 2003
Sold by
Gray John B and Gray Virginia H
Bought by
Ahn Edward S and Ahn Angela C
Current Estimated Value
Home Financials for this Owner
Home Financials are based on the most recent Mortgage that was taken out on this home.
Original Mortgage
$636,000
Outstanding Balance
$283,836
Interest Rate
5.69%
Mortgage Type
Purchase Money Mortgage
Estimated Equity
$1,966,598
Create a Home Valuation Report for This Property
The Home Valuation Report is an in-depth analysis detailing your home's value as well as a comparison with similar homes in the area
Home Values in the Area
Average Home Value in this Area
Purchase History
| Date | Buyer | Sale Price | Title Company |
|---|---|---|---|
| Ahn Edward S | $1,060,000 | -- |
Source: Public Records
Mortgage History
| Date | Status | Borrower | Loan Amount |
|---|---|---|---|
| Open | Ahn Edward S | $636,000 |
Source: Public Records
Tax History
| Year | Tax Paid | Tax Assessment Tax Assessment Total Assessment is a certain percentage of the fair market value that is determined by local assessors to be the total taxable value of land and additions on the property. | Land | Improvement |
|---|---|---|---|---|
| 2025 | $18,669 | $1,656,500 | $1,040,400 | $616,100 |
| 2024 | $17,398 | $1,587,400 | $1,010,400 | $577,000 |
| 2023 | $16,887 | $1,385,300 | $884,600 | $500,700 |
| 2022 | $16,476 | $1,326,600 | $884,600 | $442,000 |
| 2021 | $16,319 | $1,266,000 | $839,600 | $426,400 |
| 2020 | $16,255 | $1,266,000 | $839,600 | $426,400 |
| 2019 | $16,369 | $1,266,000 | $839,600 | $426,400 |
| 2018 | $14,819 | $1,154,100 | $755,800 | $398,300 |
| 2017 | $15,198 | $1,164,600 | $755,800 | $408,800 |
| 2016 | $15,000 | $1,164,600 | $755,800 | $408,800 |
| 2015 | $14,790 | $1,164,600 | $755,800 | $408,800 |
Source: Public Records
Map
Nearby Homes
- 1 Mill St
- 52 Willow St
- 8 Crestview Rd
- 24 Moseley Ave
- 34 Stratford Rd
- 1780 Central Ave
- 60 Claybrook Rd
- 957 South St
- 25 Bretton Rd
- 62 Claybrook Rd
- 37 Carleton Dr
- 365 Charles River St
- 189 Bridle Trail Rd
- 95 Deerfield Rd
- 287 High Rock St
- 569 Chestnut St
- 47 Emerson Rd
- 53 Heather Ln
- 1 Old Colony Dr
- 62 Walpole St
Your Personal Tour Guide
Ask me questions while you tour the home.