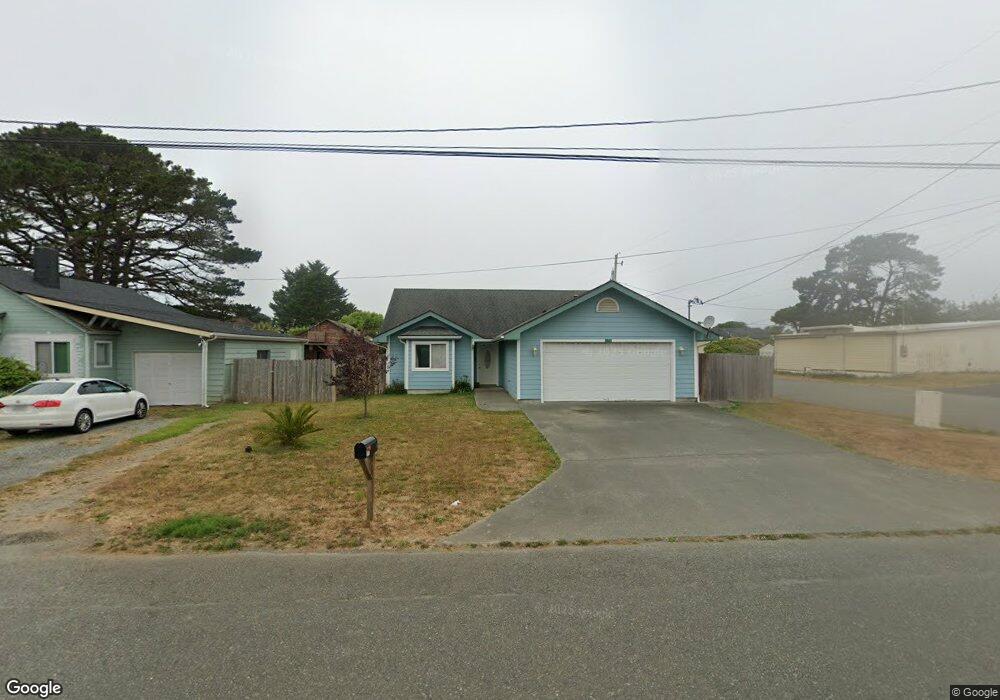
175 Del Norte St Unit 501 Macken (use this Crescent City, CA 95531
Estimated Value: $279,000 - $411,000
3
Beds
2
Baths
1,408
Sq Ft
$228/Sq Ft
Est. Value
About This Home
This home is located at 175 Del Norte St Unit 501 Macken (use this, Crescent City, CA 95531 and is currently estimated at $321,263, approximately $228 per square foot. 175 Del Norte St Unit 501 Macken (use this is a home located in Del Norte County with nearby schools including Joe Hamilton Elementary School, Crescent Elk Middle School, and Del Norte High School.
Ownership History
Date
Name
Owned For
Owner Type
Purchase Details
Closed on
Dec 28, 2011
Sold by
Fannie Mae
Bought by
Equity Trust Company
Current Estimated Value
Purchase Details
Closed on
Jun 7, 2011
Sold by
Vang Kai and Xiong Song
Bought by
Federal National Mortgage Association
Purchase Details
Closed on
Jan 20, 2006
Sold by
Minges Robert L
Bought by
Vang Kai and Xiong Song
Home Financials for this Owner
Home Financials are based on the most recent Mortgage that was taken out on this home.
Original Mortgage
$200,000
Interest Rate
6.62%
Mortgage Type
Fannie Mae Freddie Mac
Create a Home Valuation Report for This Property
The Home Valuation Report is an in-depth analysis detailing your home's value as well as a comparison with similar homes in the area
Home Values in the Area
Average Home Value in this Area
Purchase History
| Date | Buyer | Sale Price | Title Company |
|---|---|---|---|
| Equity Trust Company | $110,000 | Crescent Land Title | |
| Federal National Mortgage Association | $225,667 | First American Title Ins Co | |
| Vang Kai | $250,000 | First American Title Company | |
| Minges Robert L | -- | First American Title Company |
Source: Public Records
Mortgage History
| Date | Status | Borrower | Loan Amount |
|---|---|---|---|
| Previous Owner | Vang Kai | $200,000 |
Source: Public Records
Tax History Compared to Growth
Tax History
| Year | Tax Paid | Tax Assessment Tax Assessment Total Assessment is a certain percentage of the fair market value that is determined by local assessors to be the total taxable value of land and additions on the property. | Land | Improvement |
|---|---|---|---|---|
| 2025 | $1,649 | $138,154 | $43,956 | $94,198 |
| 2024 | $1,649 | $135,446 | $43,095 | $92,351 |
| 2023 | $1,556 | $132,791 | $42,250 | $90,541 |
| 2022 | $1,527 | $130,188 | $41,422 | $88,766 |
| 2021 | $1,518 | $127,636 | $40,610 | $87,026 |
| 2020 | $1,453 | $126,328 | $40,194 | $86,134 |
| 2019 | $1,431 | $123,852 | $39,406 | $84,446 |
| 2018 | $1,403 | $121,425 | $38,634 | $82,791 |
| 2017 | $1,474 | $119,045 | $37,877 | $81,168 |
| 2016 | $1,448 | $116,712 | $37,135 | $79,577 |
| 2015 | $1,427 | $114,960 | $36,578 | $78,382 |
| 2014 | $1,408 | $112,709 | $35,862 | $76,847 |
Source: Public Records
Map
Nearby Homes
- 501 MacKen Ave
- 155 Del Norte St
- 541 MacKen Ave
- 544 Pacific Ave
- 512 Pacific Ave
- 544 MacKen Ave
- 585 MacKen Ave
- 594 Pacific Ave
- 484 MacKen Ave
- 451 MacKen Ave
- 100 Rancho Del Norte
- 505 Lauff Ave
- 430 MacKen Ave
- 525 Lauff Ave
- 262 & 282 El Dorado St
- 625 MacKen Ave
- 600 Pacific Ave
- 485 Lauff Ave
- 614 MacKen Ave
- 455 Lauff Ave