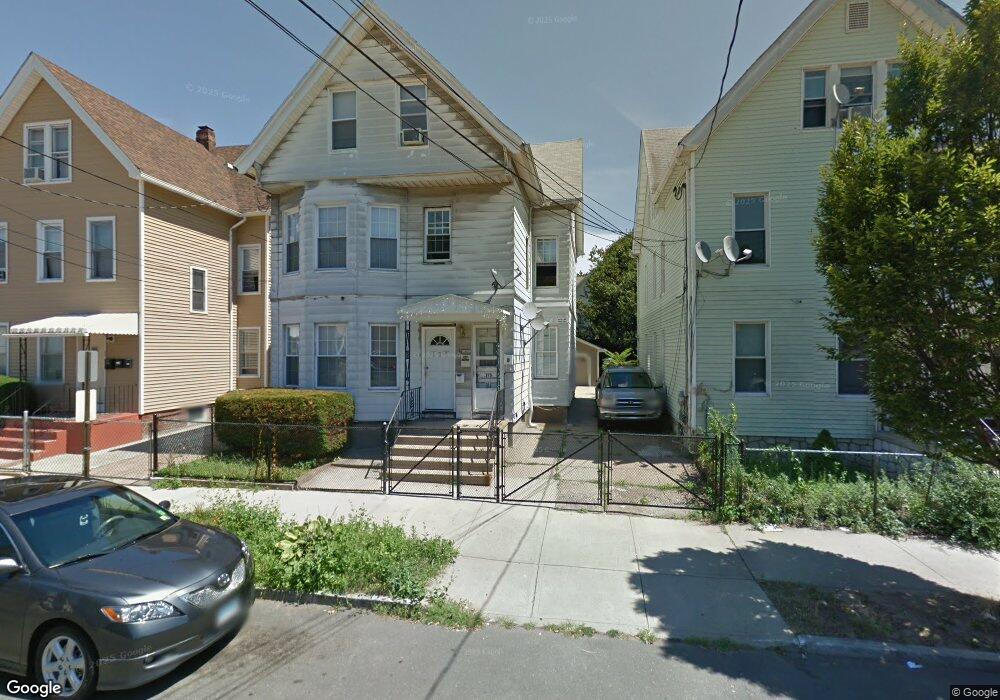
175 Fillmore St New Haven, CT 06513
Fair Haven NeighborhoodEstimated Value: $315,858 - $409,000
6
Beds
3
Baths
2,323
Sq Ft
$158/Sq Ft
Est. Value
About This Home
This home is located at 175 Fillmore St, New Haven, CT 06513 and is currently estimated at $366,215, approximately $157 per square foot. 175 Fillmore St is a home located in New Haven County with nearby schools including Clinton Avenue School, Elm City College Preparatory School, and All Saints Catholic Academy.
Ownership History
Date
Name
Owned For
Owner Type
Purchase Details
Closed on
Jul 2, 2004
Sold by
Sote Elsa
Bought by
Guirre Jose
Current Estimated Value
Home Financials for this Owner
Home Financials are based on the most recent Mortgage that was taken out on this home.
Original Mortgage
$174,757
Outstanding Balance
$87,762
Interest Rate
6.3%
Estimated Equity
$278,453
Purchase Details
Closed on
Oct 5, 2001
Sold by
Ropiak Stanley and Ropiak Zofia
Bought by
Soto Elvin
Home Financials for this Owner
Home Financials are based on the most recent Mortgage that was taken out on this home.
Original Mortgage
$108,000
Interest Rate
6.89%
Create a Home Valuation Report for This Property
The Home Valuation Report is an in-depth analysis detailing your home's value as well as a comparison with similar homes in the area
Home Values in the Area
Average Home Value in this Area
Purchase History
| Date | Buyer | Sale Price | Title Company |
|---|---|---|---|
| Guirre Jose | $177,500 | -- | |
| Soto Elvin | $120,000 | -- |
Source: Public Records
Mortgage History
| Date | Status | Borrower | Loan Amount |
|---|---|---|---|
| Open | Soto Elvin | $174,757 | |
| Previous Owner | Soto Elvin | $108,000 |
Source: Public Records
Tax History
| Year | Tax Paid | Tax Assessment Tax Assessment Total Assessment is a certain percentage of the fair market value that is determined by local assessors to be the total taxable value of land and additions on the property. | Land | Improvement |
|---|---|---|---|---|
| 2025 | $6,062 | $153,860 | $26,880 | $126,980 |
| 2024 | $5,924 | $153,860 | $26,880 | $126,980 |
| 2023 | $5,724 | $153,860 | $26,880 | $126,980 |
| 2022 | $6,116 | $153,860 | $26,880 | $126,980 |
| 2021 | $4,030 | $91,840 | $21,560 | $70,280 |
| 2020 | $4,030 | $91,840 | $21,560 | $70,280 |
| 2019 | $3,947 | $91,840 | $21,560 | $70,280 |
| 2018 | $3,947 | $91,840 | $21,560 | $70,280 |
| 2017 | $3,552 | $91,840 | $21,560 | $70,280 |
| 2016 | $2,911 | $70,070 | $14,350 | $55,720 |
| 2015 | $2,911 | $70,070 | $14,350 | $55,720 |
| 2014 | $2,911 | $70,070 | $14,350 | $55,720 |
Source: Public Records
Map
Nearby Homes
- 179 Fillmore St
- 169 Fillmore St
- 181 Fillmore St
- 165 Fillmore St
- 185 Fillmore St
- 436 Poplar St
- 442 Poplar St
- 448 Poplar St
- 434 Poplar St
- 434 Poplar St Unit 3
- 434 Poplar St Unit 2
- 434 Poplar St Unit 1
- 428 Poplar St
- 191 Fillmore St
- 452 Poplar St
- 178 Fillmore St
- 190 Fillmore St
- 182 Fillmore St
- 432 Poplar St
- 159 Fillmore St
Your Personal Tour Guide
Ask me questions while you tour the home.