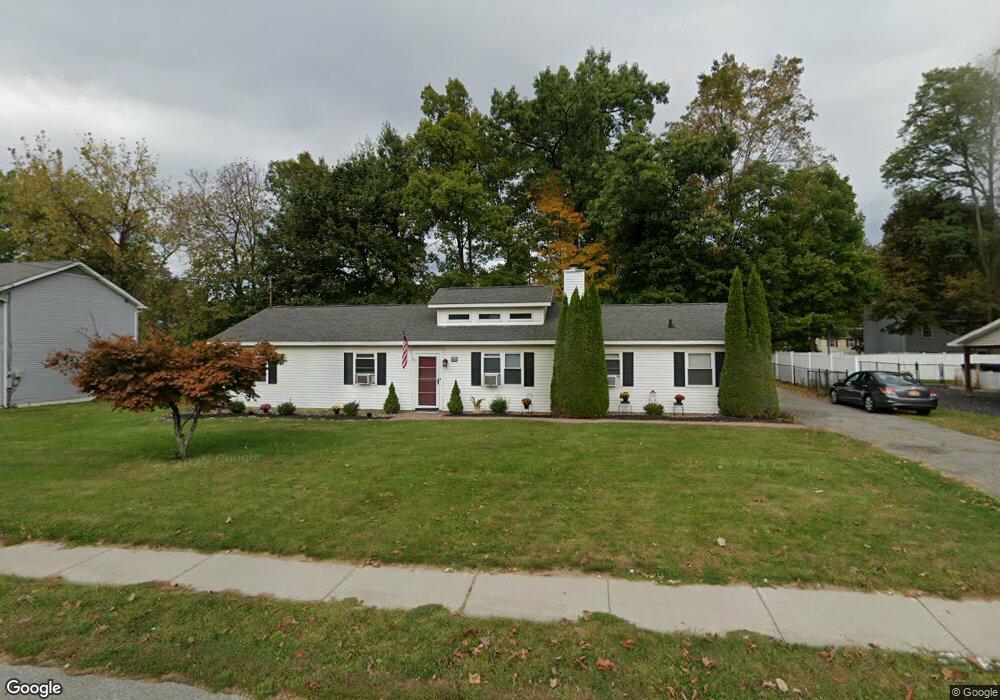
175 Fulton St Poughkeepsie, NY 12601
Estimated Value: $431,000 - $484,000
3
Beds
3
Baths
1,638
Sq Ft
$278/Sq Ft
Est. Value
About This Home
This home is located at 175 Fulton St, Poughkeepsie, NY 12601 and is currently estimated at $455,978, approximately $278 per square foot. 175 Fulton St is a home located in Dutchess County with nearby schools including Franklin D Roosevelt Senior High School, Faith Christian Academy, and Tabernacle Christian Academy.
Ownership History
Date
Name
Owned For
Owner Type
Purchase Details
Closed on
Jun 15, 2012
Sold by
Mckenna Peter
Bought by
Brennan James
Current Estimated Value
Home Financials for this Owner
Home Financials are based on the most recent Mortgage that was taken out on this home.
Original Mortgage
$230,992
Outstanding Balance
$159,484
Interest Rate
3.75%
Mortgage Type
FHA
Estimated Equity
$296,494
Purchase Details
Closed on
Jun 23, 1995
Sold by
Berard Norman F
Bought by
Mckenna Peter J and Mc Kenna Diane M
Create a Home Valuation Report for This Property
The Home Valuation Report is an in-depth analysis detailing your home's value as well as a comparison with similar homes in the area
Home Values in the Area
Average Home Value in this Area
Purchase History
| Date | Buyer | Sale Price | Title Company |
|---|---|---|---|
| Brennan James | $237,000 | Craig Wallace | |
| Mckenna Peter J | $102,000 | -- |
Source: Public Records
Mortgage History
| Date | Status | Borrower | Loan Amount |
|---|---|---|---|
| Open | Brennan James | $230,992 |
Source: Public Records
Tax History
| Year | Tax Paid | Tax Assessment Tax Assessment Total Assessment is a certain percentage of the fair market value that is determined by local assessors to be the total taxable value of land and additions on the property. | Land | Improvement |
|---|---|---|---|---|
| 2024 | $11,639 | $358,500 | $63,800 | $294,700 |
| 2023 | $13,745 | $358,500 | $63,800 | $294,700 |
| 2019 | $8,049 | $225,000 | $58,000 | $167,000 |
Source: Public Records
Map
Nearby Homes
Your Personal Tour Guide
Ask me questions while you tour the home.