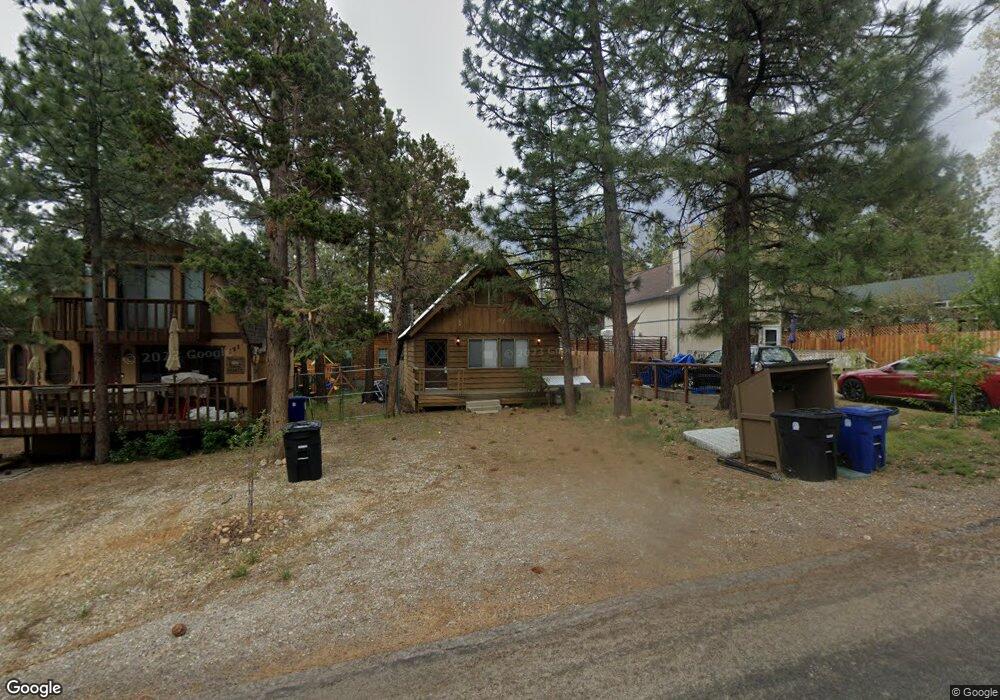
175 Holmes Ln Sugarloaf, CA 92386
Estimated Value: $218,242 - $259,000
2
Beds
1
Bath
643
Sq Ft
$366/Sq Ft
Est. Value
About This Home
This home is located at 175 Holmes Ln, Sugarloaf, CA 92386 and is currently estimated at $235,311, approximately $365 per square foot. 175 Holmes Ln is a home with nearby schools including Baldwin Lane Elementary School, Big Bear Middle School, and Big Bear High School.
Ownership History
Date
Name
Owned For
Owner Type
Purchase Details
Closed on
Dec 28, 1999
Sold by
Calpino Joseph Tr
Bought by
Flores Ruben and Flores Sylvia L
Current Estimated Value
Home Financials for this Owner
Home Financials are based on the most recent Mortgage that was taken out on this home.
Original Mortgage
$35,600
Outstanding Balance
$11,337
Interest Rate
7.87%
Mortgage Type
Purchase Money Mortgage
Estimated Equity
$223,974
Purchase Details
Closed on
Nov 19, 1998
Sold by
Calpino Joseph and Calpino Dorothy M
Bought by
Calpino Joseph and Calpino Dorothy M
Purchase Details
Closed on
Nov 21, 1997
Sold by
Dargatz Dwayne R and Dargatz Johanna Johanna
Bought by
Calpino Joseph and Calpino Dorothy M
Home Financials for this Owner
Home Financials are based on the most recent Mortgage that was taken out on this home.
Original Mortgage
$40,500
Interest Rate
7.23%
Mortgage Type
Purchase Money Mortgage
Create a Home Valuation Report for This Property
The Home Valuation Report is an in-depth analysis detailing your home's value as well as a comparison with similar homes in the area
Home Values in the Area
Average Home Value in this Area
Purchase History
| Date | Buyer | Sale Price | Title Company |
|---|---|---|---|
| Flores Ruben | $48,000 | Fidelity National Title Ins | |
| Calpino Joseph | -- | -- | |
| Calpino Joseph | $45,000 | Commonwealth Land Title Co |
Source: Public Records
Mortgage History
| Date | Status | Borrower | Loan Amount |
|---|---|---|---|
| Open | Flores Ruben | $35,600 | |
| Previous Owner | Calpino Joseph | $40,500 | |
| Closed | Flores Ruben | $10,000 |
Source: Public Records
Tax History
| Year | Tax Paid | Tax Assessment Tax Assessment Total Assessment is a certain percentage of the fair market value that is determined by local assessors to be the total taxable value of land and additions on the property. | Land | Improvement |
|---|---|---|---|---|
| 2025 | $2,150 | $73,780 | $18,448 | $55,332 |
| 2024 | $2,036 | $72,333 | $18,086 | $54,247 |
| 2023 | $1,947 | $70,914 | $17,731 | $53,183 |
| 2022 | $1,850 | $69,523 | $17,383 | $52,140 |
| 2021 | $1,800 | $68,160 | $17,042 | $51,118 |
| 2020 | $1,775 | $67,461 | $16,867 | $50,594 |
| 2019 | $1,736 | $66,138 | $16,536 | $49,602 |
| 2018 | $1,666 | $64,841 | $16,212 | $48,629 |
| 2017 | $1,614 | $63,569 | $15,894 | $47,675 |
| 2016 | $1,570 | $62,322 | $15,582 | $46,740 |
| 2015 | $1,536 | $61,386 | $15,348 | $46,038 |
| 2014 | $1,505 | $60,183 | $15,047 | $45,136 |
Source: Public Records
Map
Nearby Homes
- 140 Highland Ln
- 216 Leonard Ln
- 156 Victoria Ln
- 170 Wabash Ln
- 271 Leonard Ln
- 165 Sunset Ln
- 284 Leonard Ln
- 225 Sunset Ln
- 304 Highland Ln
- 115 Sunset Ln
- 196 Sunset Ln
- 259 Victoria Ln
- 48268 Curvate Baldwin Ln
- 0 Baldwin Ln
- 305 Wabash Ln
- 326 Holmes Ln
- 151 Vista Ln
- 306 Victoria Ln
- 245 Vista Ave
- 317 Moreno Ln
Your Personal Tour Guide
Ask me questions while you tour the home.