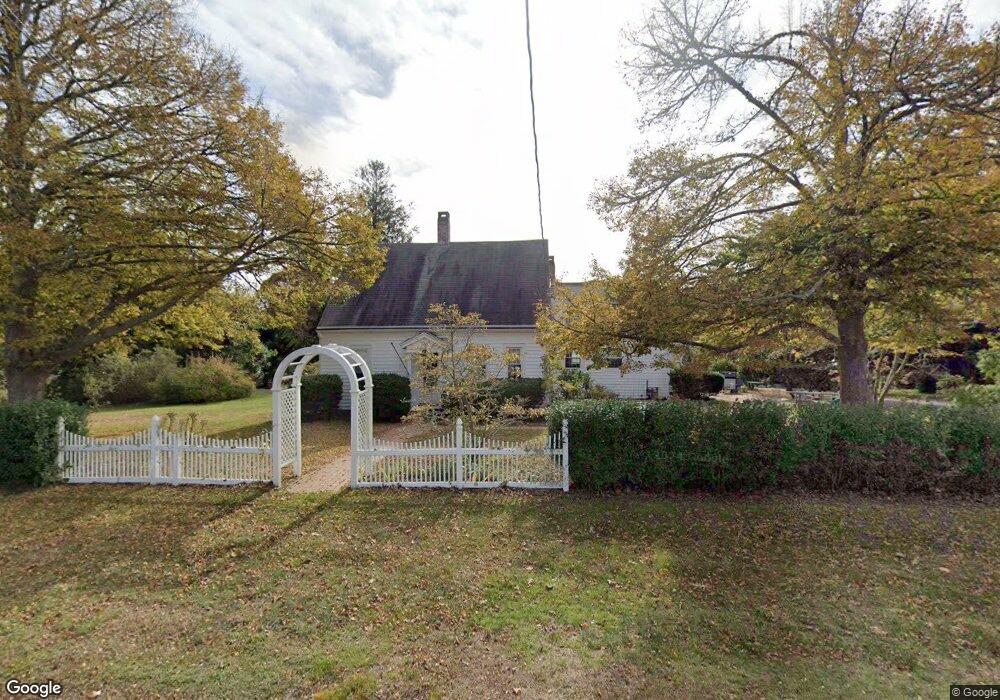
175 Main St Orleans, MA 02653
Estimated Value: $306,000 - $1,512,745
4
Beds
3
Baths
2,271
Sq Ft
$465/Sq Ft
Est. Value
About This Home
This home is located at 175 Main St, Orleans, MA 02653 and is currently estimated at $1,056,186, approximately $465 per square foot. 175 Main St is a home located in Barnstable County with nearby schools including Orleans Elementary School, Nauset Regional Middle School, and Nauset Regional High School.
Ownership History
Date
Name
Owned For
Owner Type
Purchase Details
Closed on
Jul 26, 2024
Sold by
White Frank I
Bought by
White Bruce A
Current Estimated Value
Purchase Details
Closed on
Jun 20, 2024
Sold by
White Bruce A
Bought by
White Bruce A and White Carol
Purchase Details
Closed on
Nov 8, 2019
Sold by
Frank E White T
Bought by
White Frank I and White Bruce A
Purchase Details
Closed on
Aug 2, 2018
Sold by
Caroline White 2018 Lt and White
Bought by
White Caroline
Purchase Details
Closed on
May 18, 2018
Sold by
White Frank E and White Caroline
Bought by
Caroline White 2018 Lt and White
Create a Home Valuation Report for This Property
The Home Valuation Report is an in-depth analysis detailing your home's value as well as a comparison with similar homes in the area
Home Values in the Area
Average Home Value in this Area
Purchase History
| Date | Buyer | Sale Price | Title Company |
|---|---|---|---|
| White Bruce A | $200,000 | None Available | |
| White Bruce A | $200,000 | None Available | |
| White Bruce A | $200,000 | None Available | |
| White Bruce A | -- | None Available | |
| White Bruce A | -- | None Available | |
| White Bruce A | -- | None Available | |
| White Frank I | -- | -- | |
| White Frank I | -- | -- | |
| Frank White T | -- | -- | |
| Frank White T | -- | -- | |
| White Caroline | -- | -- | |
| White Caroline | -- | -- | |
| White Caroline | -- | -- | |
| Caroline White 2018 Lt | -- | -- | |
| Caroline White 2018 Lt | -- | -- | |
| Caroline White 2018 Lt | -- | -- |
Source: Public Records
Mortgage History
| Date | Status | Borrower | Loan Amount |
|---|---|---|---|
| Previous Owner | Caroline White 2018 Lt | $50,000 | |
| Previous Owner | Caroline White 2018 Lt | $25,000 | |
| Previous Owner | Caroline White 2018 Lt | $50,000 |
Source: Public Records
Tax History Compared to Growth
Tax History
| Year | Tax Paid | Tax Assessment Tax Assessment Total Assessment is a certain percentage of the fair market value that is determined by local assessors to be the total taxable value of land and additions on the property. | Land | Improvement |
|---|---|---|---|---|
| 2025 | $8,530 | $1,367,000 | $0 | $1,367,000 |
| 2024 | $7,654 | $1,194,000 | $0 | $1,194,000 |
| 2023 | $6,998 | $1,123,300 | $0 | $1,123,300 |
| 2022 | $5,967 | $828,700 | $0 | $828,700 |
| 2021 | $5,620 | $716,900 | $0 | $716,900 |
| 2020 | $5,334 | $705,500 | $0 | $705,500 |
| 2019 | $3,573 | $702,800 | $0 | $702,800 |
| 2018 | $4,508 | $679,900 | $0 | $679,900 |
| 2017 | $4,023 | $635,500 | $0 | $635,500 |
| 2016 | $4,013 | $621,200 | $0 | $621,200 |
| 2015 | $3,916 | $610,000 | $0 | $610,000 |
Source: Public Records
Map
Nearby Homes
- 216 Main St
- 31 Monument Rd
- 18 Cole Place
- 66 Tides End Ln
- 6 Apple Way
- 53 Great Oak Rd
- 19 Nauset Farms Private Way
- 75 Monument Rd
- 44 Tonset Rd
- 22 Tonset Rd
- 10 Lake Farm Ln
- 95 S Orleans Rd
- 13 S Orleans Rd Unit 28
- 21 S Orleans Rd
- 47 Daley Terrace
- 10 Center Place Unit 15
- 10 Center Place Unit 16
- 2 Little Cove Ln
- 25 Pleasant View Dr
- 241 Tonset Rd