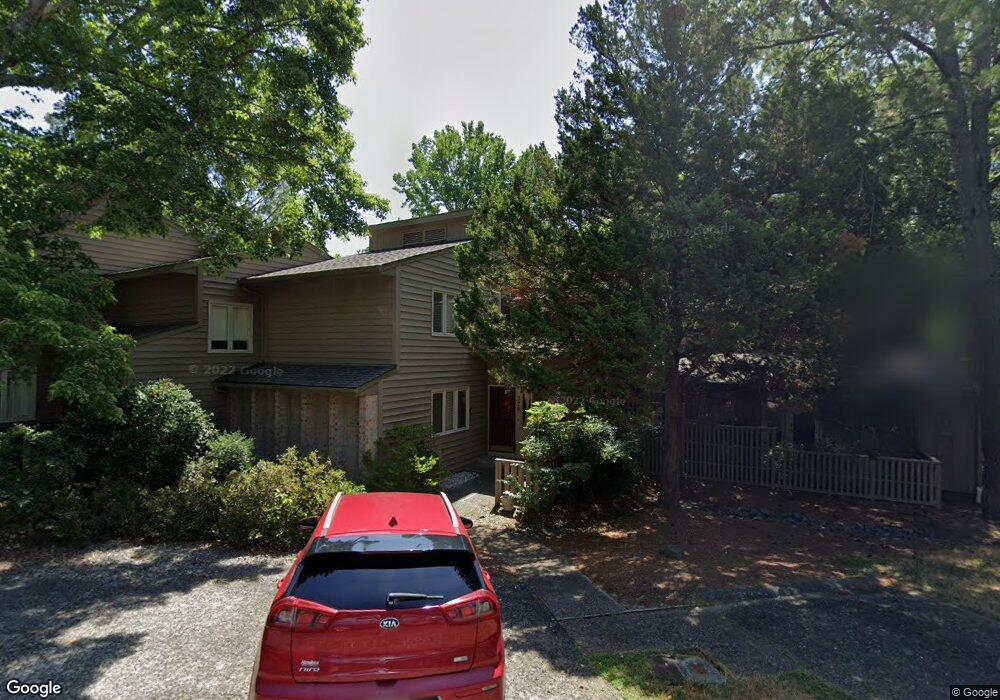
175 Montrose Dr Durham, NC 27707
Hope Valley NeighborhoodEstimated Value: $373,000 - $396,751
3
Beds
2
Baths
1,739
Sq Ft
$218/Sq Ft
Est. Value
About This Home
This home is located at 175 Montrose Dr, Durham, NC 27707 and is currently estimated at $379,688, approximately $218 per square foot. 175 Montrose Dr is a home located in Durham County with nearby schools including Morehead Montessori, Hope Valley Elementary, and Sherwood Githens Middle.
Ownership History
Date
Name
Owned For
Owner Type
Purchase Details
Closed on
Sep 13, 2018
Sold by
Tucci Debara L and Vanlandingham Kevan E
Bought by
Burns Michael J and Copeland Burns Carla
Current Estimated Value
Home Financials for this Owner
Home Financials are based on the most recent Mortgage that was taken out on this home.
Original Mortgage
$193,500
Outstanding Balance
$168,396
Interest Rate
4.5%
Mortgage Type
New Conventional
Estimated Equity
$211,292
Purchase Details
Closed on
Aug 19, 2005
Sold by
Tucci Barbara V
Bought by
Tucci Barbara V and Tucci Debara
Home Financials for this Owner
Home Financials are based on the most recent Mortgage that was taken out on this home.
Original Mortgage
$161,000
Interest Rate
5.5%
Mortgage Type
New Conventional
Purchase Details
Closed on
Mar 3, 2004
Sold by
Kirwan Richard F and Kirwan Helen
Bought by
Tucci Barbara V
Home Financials for this Owner
Home Financials are based on the most recent Mortgage that was taken out on this home.
Original Mortgage
$168,500
Interest Rate
5.72%
Mortgage Type
Construction
Create a Home Valuation Report for This Property
The Home Valuation Report is an in-depth analysis detailing your home's value as well as a comparison with similar homes in the area
Home Values in the Area
Average Home Value in this Area
Purchase History
| Date | Buyer | Sale Price | Title Company |
|---|---|---|---|
| Burns Michael J | $215,000 | None Available | |
| Tucci Barbara V | -- | -- | |
| Tucci Barbara V | $168,500 | -- |
Source: Public Records
Mortgage History
| Date | Status | Borrower | Loan Amount |
|---|---|---|---|
| Open | Burns Michael J | $193,500 | |
| Previous Owner | Tucci Barbara V | $161,000 | |
| Previous Owner | Tucci Barbara V | $168,500 |
Source: Public Records
Tax History
| Year | Tax Paid | Tax Assessment Tax Assessment Total Assessment is a certain percentage of the fair market value that is determined by local assessors to be the total taxable value of land and additions on the property. | Land | Improvement |
|---|---|---|---|---|
| 2025 | $3,728 | $376,091 | $146,000 | $230,091 |
| 2024 | $2,897 | $207,654 | $45,000 | $162,654 |
| 2023 | $2,720 | $207,654 | $45,000 | $162,654 |
| 2022 | $2,658 | $207,654 | $45,000 | $162,654 |
| 2021 | $2,645 | $207,654 | $45,000 | $162,654 |
| 2020 | $2,583 | $207,654 | $45,000 | $162,654 |
| 2019 | $2,583 | $207,654 | $45,000 | $162,654 |
| 2018 | $2,713 | $200,001 | $40,000 | $160,001 |
| 2017 | $2,693 | $200,001 | $40,000 | $160,001 |
| 2016 | $2,602 | $200,001 | $40,000 | $160,001 |
| 2015 | $2,958 | $213,660 | $46,500 | $167,160 |
| 2014 | $2,958 | $213,660 | $46,500 | $167,160 |
Source: Public Records
Map
Nearby Homes
- 104 Archdale Dr
- 2235 Alpine Rd
- 212 Barnhill St
- 226 Barnhill St
- 3203 Stanford Dr
- 3125 Stanford Dr
- 3014 Hope Valley Rd
- 801 Springdale Dr
- 305 Reynolds Ave N
- 1311 Martin Luther King Junior Pkwy
- 2810 Beechwood Dr
- 2831 Beechwood Dr
- 2146 Charles St Unit 12
- 2146 Charles St Unit 40
- 3457 Hope Valley Rd
- 3033 University Dr
- 101 W Woodridge Dr
- 704 Brighton Rd
- 2910 Driftwood Dr
- 3010 Cedarwood Dr
- 176 Montrose Dr
- 174 Montrose Dr
- 173 Montrose Dr
- 169 Montrose Dr
- 177 Montrose Dr
- 168 Montrose Dr
- 178 Montrose Dr
- 167 Montrose Dr
- 179 Montrose Dr
- 171 Montrose Dr
- 165 Montrose Dr
- 164 Montrose Dr
- 170 Montrose Dr
- 180 Montrose Dr
- 166 Montrose Dr
- 208 Selkirk St
- 163 Montrose Dr
- 181 Montrose Dr
- 158 Montrose Dr
- 207 Selkirk St
Your Personal Tour Guide
Ask me questions while you tour the home.