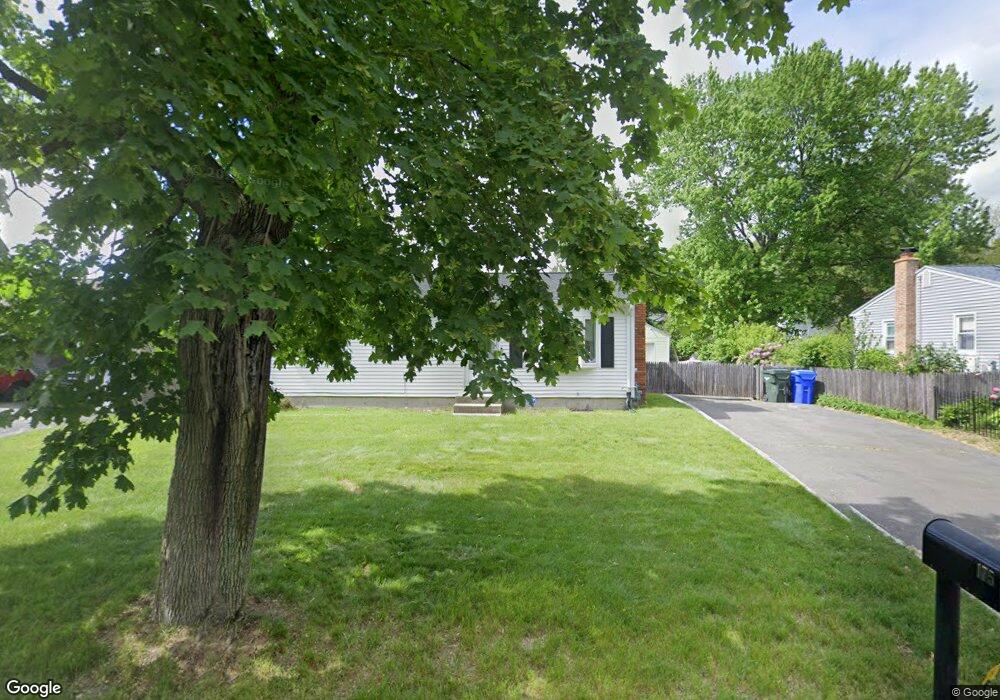
175 Moss Rd Springfield, MA 01119
Sixteen Acres NeighborhoodEstimated Value: $277,000 - $327,000
3
Beds
2
Baths
864
Sq Ft
$353/Sq Ft
Est. Value
About This Home
This home is located at 175 Moss Rd, Springfield, MA 01119 and is currently estimated at $304,761, approximately $352 per square foot. 175 Moss Rd is a home located in Hampden County with nearby schools including Mary M. Lynch Elementary School, John J Duggan Middle, and Springfield Central High School.
Ownership History
Date
Name
Owned For
Owner Type
Purchase Details
Closed on
Sep 8, 2023
Sold by
Johnson Eric
Bought by
Johnson Marcus
Current Estimated Value
Home Financials for this Owner
Home Financials are based on the most recent Mortgage that was taken out on this home.
Original Mortgage
$185,305
Outstanding Balance
$181,263
Interest Rate
6.81%
Mortgage Type
Purchase Money Mortgage
Estimated Equity
$123,498
Purchase Details
Closed on
Jul 8, 2019
Sold by
Stasiak Paul J and Stasiak Darrell F
Bought by
Johnson Edwin and Johnson Lily
Create a Home Valuation Report for This Property
The Home Valuation Report is an in-depth analysis detailing your home's value as well as a comparison with similar homes in the area
Home Values in the Area
Average Home Value in this Area
Purchase History
| Date | Buyer | Sale Price | Title Company |
|---|---|---|---|
| Johnson Marcus | $270,000 | None Available | |
| Johnson Edwin | $210,000 | -- |
Source: Public Records
Mortgage History
| Date | Status | Borrower | Loan Amount |
|---|---|---|---|
| Open | Johnson Marcus | $185,305 |
Source: Public Records
Tax History
| Year | Tax Paid | Tax Assessment Tax Assessment Total Assessment is a certain percentage of the fair market value that is determined by local assessors to be the total taxable value of land and additions on the property. | Land | Improvement |
|---|---|---|---|---|
| 2025 | $4,072 | $259,700 | $51,600 | $208,100 |
| 2024 | $3,993 | $248,600 | $51,600 | $197,000 |
| 2023 | $3,942 | $231,200 | $49,200 | $182,000 |
| 2022 | $3,802 | $202,000 | $49,200 | $152,800 |
| 2021 | $3,593 | $190,100 | $44,700 | $145,400 |
| 2020 | $3,215 | $164,600 | $44,700 | $119,900 |
| 2019 | $2,938 | $149,300 | $44,700 | $104,600 |
| 2018 | $2,533 | $154,700 | $44,700 | $110,000 |
| 2017 | $2,933 | $149,200 | $44,400 | $104,800 |
| 2016 | $2,770 | $140,900 | $44,400 | $96,500 |
| 2015 | $2,711 | $137,800 | $44,400 | $93,400 |
Source: Public Records
Map
Nearby Homes
Your Personal Tour Guide
Ask me questions while you tour the home.