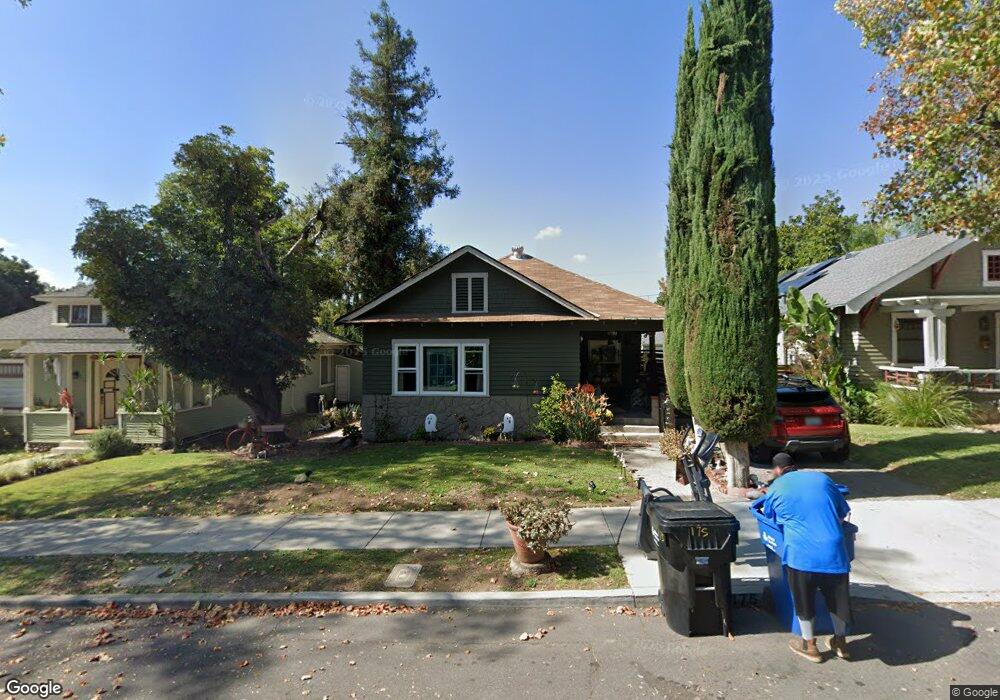
175 N Encinitas Ave Monrovia, CA 91016
Estimated Value: $938,098 - $989,000
2
Beds
2
Baths
1,106
Sq Ft
$865/Sq Ft
Est. Value
About This Home
This home is located at 175 N Encinitas Ave, Monrovia, CA 91016 and is currently estimated at $957,025, approximately $865 per square foot. 175 N Encinitas Ave is a home located in Los Angeles County with nearby schools including Mayflower Elementary School, Clifton Middle School, and Monrovia High School.
Ownership History
Date
Name
Owned For
Owner Type
Purchase Details
Closed on
Sep 27, 2006
Sold by
Virgen Jessica
Bought by
Virgen Jose L
Current Estimated Value
Home Financials for this Owner
Home Financials are based on the most recent Mortgage that was taken out on this home.
Original Mortgage
$108,000
Interest Rate
6.44%
Mortgage Type
Stand Alone Second
Purchase Details
Closed on
Aug 21, 2006
Sold by
Engel Charlotte R and The Engel Family Trust
Bought by
Virgen Jose L
Home Financials for this Owner
Home Financials are based on the most recent Mortgage that was taken out on this home.
Original Mortgage
$108,000
Interest Rate
6.44%
Mortgage Type
Stand Alone Second
Purchase Details
Closed on
Sep 22, 2003
Sold by
Engel Clarence W and Engel Charlotte R
Bought by
Engel Clarence W
Purchase Details
Closed on
Dec 8, 2002
Sold by
Engel Clarence W and Engel Charlotte R
Bought by
Engel Clarence W
Create a Home Valuation Report for This Property
The Home Valuation Report is an in-depth analysis detailing your home's value as well as a comparison with similar homes in the area
Home Values in the Area
Average Home Value in this Area
Purchase History
| Date | Buyer | Sale Price | Title Company |
|---|---|---|---|
| Virgen Jose L | -- | Southland Title | |
| Virgen Jose L | $525,000 | Southland Title | |
| Engel Clarence W | -- | -- | |
| Engel Clarence W | -- | -- |
Source: Public Records
Mortgage History
| Date | Status | Borrower | Loan Amount |
|---|---|---|---|
| Closed | Virgen Jose L | $108,000 | |
| Open | Virgen Jose L | $417,000 |
Source: Public Records
Tax History Compared to Growth
Tax History
| Year | Tax Paid | Tax Assessment Tax Assessment Total Assessment is a certain percentage of the fair market value that is determined by local assessors to be the total taxable value of land and additions on the property. | Land | Improvement |
|---|---|---|---|---|
| 2025 | $9,413 | $703,369 | $643,089 | $60,280 |
| 2024 | $9,413 | $689,579 | $630,480 | $59,099 |
| 2023 | $9,196 | $676,059 | $618,118 | $57,941 |
| 2022 | $8,929 | $662,804 | $605,999 | $56,805 |
| 2021 | $8,757 | $649,809 | $594,117 | $55,692 |
| 2019 | $8,337 | $630,538 | $576,497 | $54,041 |
| 2018 | $8,132 | $618,176 | $565,194 | $52,982 |
| 2016 | $7,078 | $534,000 | $488,000 | $46,000 |
| 2015 | $7,021 | $534,000 | $488,000 | $46,000 |
| 2014 | $7,079 | $534,000 | $488,000 | $46,000 |
Source: Public Records
Map
Nearby Homes
- 137 N Myrtle Ave
- 235 E Foothill Blvd Unit B
- 267 Linwood Ave Unit E
- 375 N Canyon Blvd
- 378 Patterson Dr
- 334 Linwood Ave
- 425 N Canyon Blvd
- 416 W Hillcrest Blvd
- 444 N Myrtle Ave
- 426 N Canyon Blvd
- 430 N Canyon Blvd
- 208 Highland Place
- 438 Crestview Place
- 516 Linwood Ave
- 357 N Mountain Ave
- 421 W Colorado Blvd
- 824 Ocean View Ave
- 717 S Magnolia Ave
- 214 Violet Ave Unit E
- 418 E Olive Ave
- 171 N Encinitas Ave
- 177 N Encinitas Ave
- 167 N Encinitas Ave
- 176 N Myrtle Ave
- 163 N Encinitas Ave
- 178 N Myrtle Ave
- 172 N Myrtle Ave
- 201 N Encinitas Ave
- 166 N Myrtle Ave
- 176 N Encinitas Ave
- 180 N Encinitas Ave
- 172 N Encinitas Ave
- 159 N Encinitas Ave
- 205 N Encinitas Ave
- 164 N Myrtle Ave
- 202 N Myrtle Ave
- 168 N Encinitas Ave
- 164 N Encinitas Ave
- 202 N Encinitas Ave
- 160 N Myrtle Ave