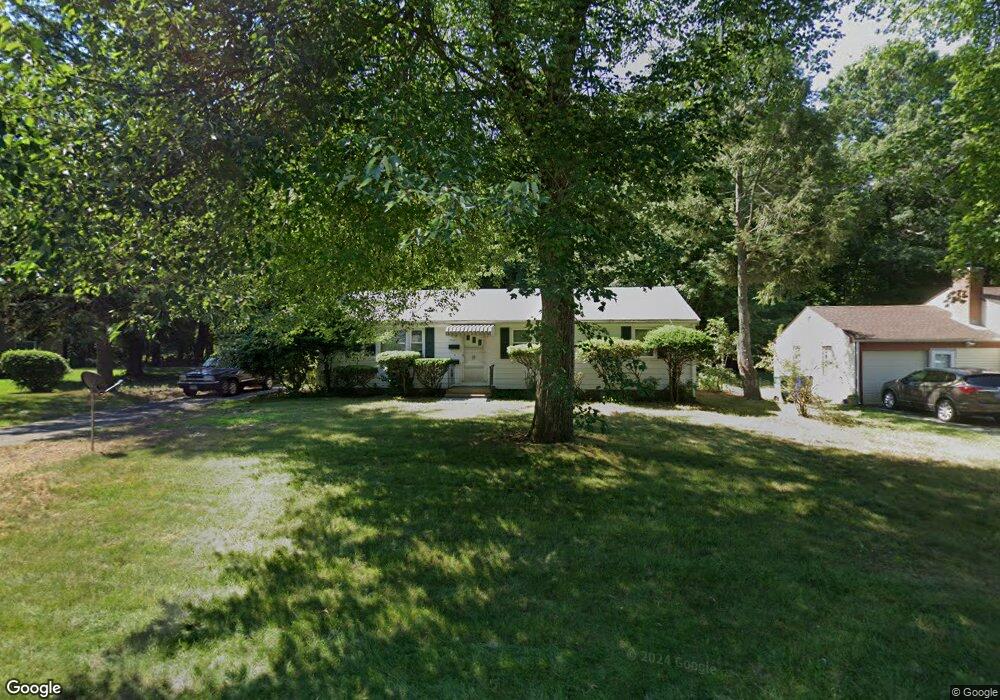
175 Pershing St Bloomfield, CT 06002
West Windsor NeighborhoodEstimated Value: $296,000 - $340,000
3
Beds
1
Bath
1,128
Sq Ft
$286/Sq Ft
Est. Value
About This Home
This home is located at 175 Pershing St, Bloomfield, CT 06002 and is currently estimated at $322,561, approximately $285 per square foot. 175 Pershing St is a home located in Hartford County with nearby schools including Poquonock Elementary School, Clover Street School, and Sage Park Middle School.
Ownership History
Date
Name
Owned For
Owner Type
Purchase Details
Closed on
Dec 18, 2025
Sold by
Joma Properties Llc
Bought by
Class Nicole Y and Lopez-Santiago Jashua
Current Estimated Value
Home Financials for this Owner
Home Financials are based on the most recent Mortgage that was taken out on this home.
Original Mortgage
$343,660
Outstanding Balance
$343,309
Interest Rate
6.22%
Mortgage Type
New Conventional
Estimated Equity
-$20,748
Purchase Details
Closed on
Jun 13, 2025
Sold by
Hall Maxine Lee Est and Smith
Bought by
Joma Properties Llc
Home Financials for this Owner
Home Financials are based on the most recent Mortgage that was taken out on this home.
Original Mortgage
$220,000
Interest Rate
6.76%
Mortgage Type
Commercial
Create a Home Valuation Report for This Property
The Home Valuation Report is an in-depth analysis detailing your home's value as well as a comparison with similar homes in the area
Home Values in the Area
Average Home Value in this Area
Purchase History
| Date | Buyer | Sale Price | Title Company |
|---|---|---|---|
| Class Nicole Y | $350,000 | -- | |
| Joma Properties Llc | $263,000 | None Available | |
| Joma Properties Llc | $263,000 | None Available |
Source: Public Records
Mortgage History
| Date | Status | Borrower | Loan Amount |
|---|---|---|---|
| Open | Class Nicole Y | $343,660 | |
| Previous Owner | Joma Properties Llc | $220,000 |
Source: Public Records
Tax History
| Year | Tax Paid | Tax Assessment Tax Assessment Total Assessment is a certain percentage of the fair market value that is determined by local assessors to be the total taxable value of land and additions on the property. | Land | Improvement |
|---|---|---|---|---|
| 2025 | $4,491 | $157,850 | $51,380 | $106,470 |
| 2024 | $4,786 | $157,850 | $51,380 | $106,470 |
| 2023 | $3,502 | $104,230 | $35,840 | $68,390 |
| 2022 | $3,468 | $104,230 | $35,840 | $68,390 |
| 2021 | $3,468 | $104,230 | $35,840 | $68,390 |
| 2020 | $3,451 | $104,230 | $35,840 | $68,390 |
| 2019 | $3,375 | $104,230 | $35,840 | $68,390 |
| 2018 | $3,189 | $96,740 | $35,840 | $60,900 |
| 2017 | $3,139 | $96,740 | $35,840 | $60,900 |
| 2016 | $3,049 | $96,740 | $35,840 | $60,900 |
| 2015 | $2,991 | $96,740 | $35,840 | $60,900 |
| 2014 | $2,948 | $96,740 | $35,840 | $60,900 |
Source: Public Records
Map
Nearby Homes
- 97 Boothbay St
- 97 E Burnham St
- 35 Baltic St
- 26 Baltic St Unit 28
- 13 Patton Rd
- 11 Pershing St Unit 13
- 747 Blue Hills Ave
- 18 Darby St
- 200 Hartland St
- 86 Hartland St
- 90 Manchester St
- 57 Love Ln
- 110 Darby St
- 46 Risley St
- 275 Westland St
- 83 Colebrook St Unit 85
- 51 Pembroke St
- 218 Martin St Unit 220
- 180 Brookline Ave
- 95 Hampton St
- 183 E Pershing St
- 123 E Pershing St
- 199 E Pershing St
- 182 E Pershing St
- 182 Pershing St
- 124 E Pershing St
- 121 E Pershing St
- 191 Pershing St
- 122 E Pershing St
- 186 Pershing St
- 119 E Pershing St
- 120 E Pershing St
- 191 E Pershing St
- 195 Pershing St
- 67 Jackson Rd
- 194 Pershing St
- 66 Jackson Rd
- 65 Jackson Rd
- 116 E Pershing St
Your Personal Tour Guide
Ask me questions while you tour the home.