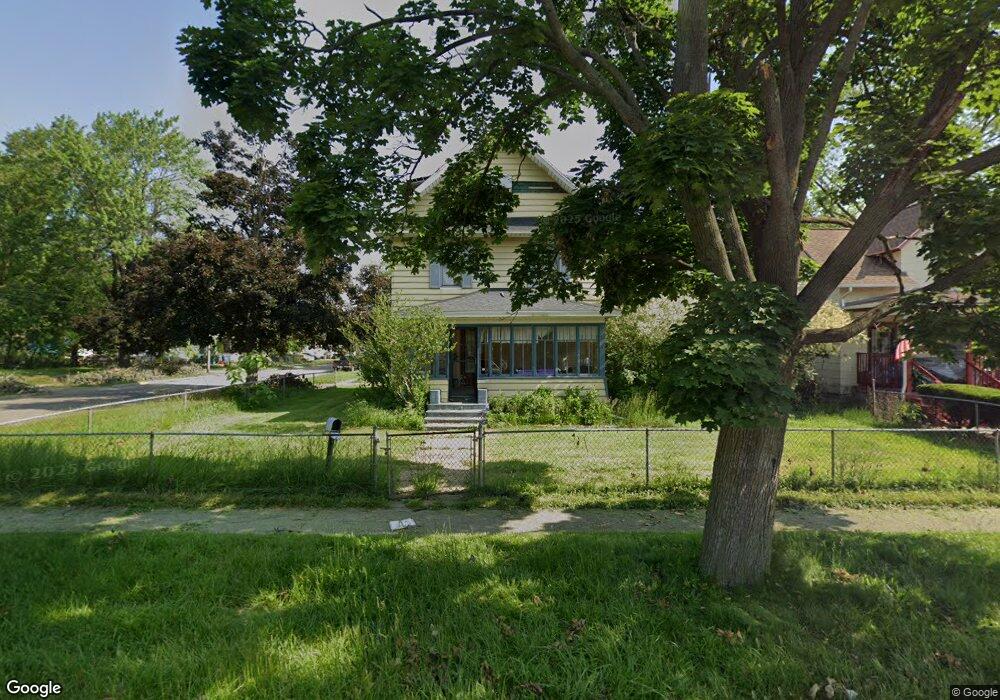
175 Post Ave Battle Creek, MI 49014
Post Franklin NeighborhoodEstimated Value: $86,000 - $118,000
2
Beds
2
Baths
1,856
Sq Ft
$55/Sq Ft
Est. Value
About This Home
This home is located at 175 Post Ave, Battle Creek, MI 49014 and is currently estimated at $102,580, approximately $55 per square foot. 175 Post Ave is a home located in Calhoun County with nearby schools including Post-Franklin Elementary School, Springfield Middle School, and Battle Creek Central High School.
Ownership History
Date
Name
Owned For
Owner Type
Purchase Details
Closed on
Aug 10, 2018
Sold by
Homesolutions Properties Llc
Bought by
Silver Pine Llc
Current Estimated Value
Purchase Details
Closed on
Nov 25, 2008
Sold by
Federal National Mortgage Association
Bought by
Homesolutions Properties Llc
Purchase Details
Closed on
Sep 12, 2008
Sold by
Fidelity Bank
Bought by
Federal National Mortgage Association
Purchase Details
Closed on
Sep 11, 2008
Sold by
Tousey Harold and Tousey Debra
Bought by
Fidelity Bank
Purchase Details
Closed on
Nov 30, 2001
Sold by
Tousey Ii Harold S
Bought by
Tousey Ii Harold S and Tousey Debra
Create a Home Valuation Report for This Property
The Home Valuation Report is an in-depth analysis detailing your home's value as well as a comparison with similar homes in the area
Home Values in the Area
Average Home Value in this Area
Purchase History
| Date | Buyer | Sale Price | Title Company |
|---|---|---|---|
| Silver Pine Llc | -- | None Available | |
| Homesolutions Properties Llc | $2,442 | None Available | |
| Federal National Mortgage Association | -- | None Available | |
| Fidelity Bank | $39,441 | None Available | |
| Tousey Ii Harold S | -- | -- |
Source: Public Records
Tax History Compared to Growth
Tax History
| Year | Tax Paid | Tax Assessment Tax Assessment Total Assessment is a certain percentage of the fair market value that is determined by local assessors to be the total taxable value of land and additions on the property. | Land | Improvement |
|---|---|---|---|---|
| 2025 | -- | $45,300 | $0 | $0 |
| 2024 | $988 | $38,130 | $0 | $0 |
| 2023 | $1,129 | $34,854 | $0 | $0 |
| 2022 | $892 | $27,198 | $0 | $0 |
| 2021 | $1,065 | $25,539 | $0 | $0 |
| 2020 | $932 | $22,482 | $0 | $0 |
| 2019 | $932 | $21,591 | $0 | $0 |
| 2018 | $932 | $20,044 | $660 | $19,384 |
| 2017 | $954 | $21,292 | $0 | $0 |
| 2016 | $952 | $22,739 | $0 | $0 |
| 2015 | $948 | $20,568 | $3,275 | $17,293 |
| 2014 | $948 | $20,568 | $3,275 | $17,293 |
Source: Public Records
Map
Nearby Homes