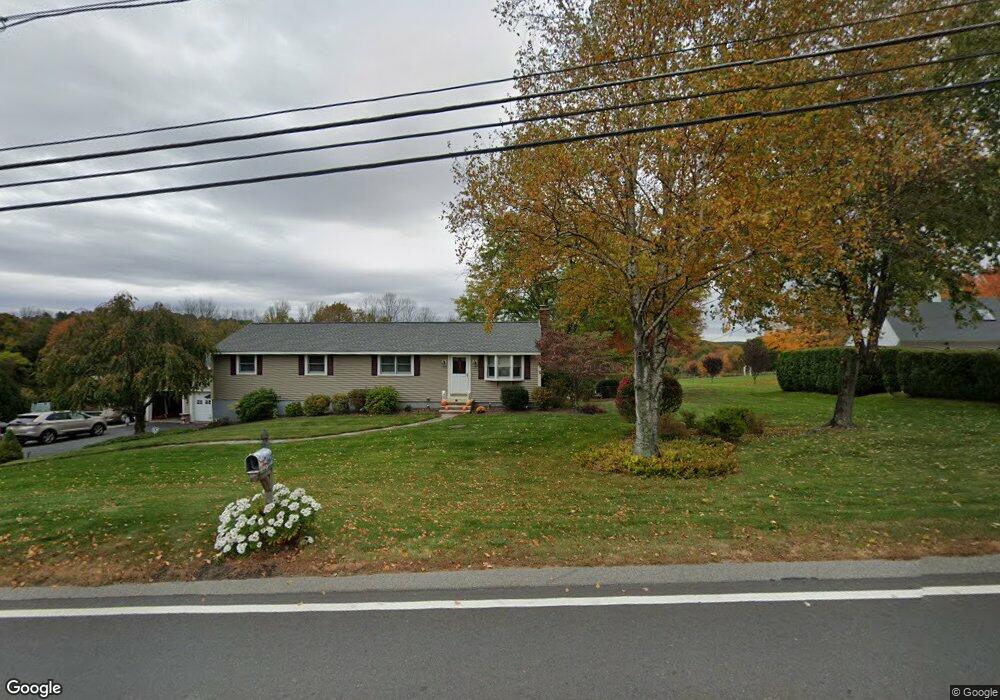
175 Putnam Hill Rd Sutton, MA 01590
Estimated Value: $634,247 - $757,000
3
Beds
3
Baths
1,938
Sq Ft
$356/Sq Ft
Est. Value
About This Home
This home is located at 175 Putnam Hill Rd, Sutton, MA 01590 and is currently estimated at $689,812, approximately $355 per square foot. 175 Putnam Hill Rd is a home located in Worcester County with nearby schools including Sutton Elementary School, Sutton Middle School, and Sutton High School.
Ownership History
Date
Name
Owned For
Owner Type
Purchase Details
Closed on
Apr 28, 2025
Sold by
Cook Ft and Cook
Bought by
Cook Irt and Cook
Current Estimated Value
Purchase Details
Closed on
Nov 7, 2016
Sold by
Cook Robert P and Cook Linda M
Bought by
Cook Ft and Cook
Create a Home Valuation Report for This Property
The Home Valuation Report is an in-depth analysis detailing your home's value as well as a comparison with similar homes in the area
Home Values in the Area
Average Home Value in this Area
Purchase History
| Date | Buyer | Sale Price | Title Company |
|---|---|---|---|
| Cook Irt | -- | None Available | |
| Cook Irt | -- | None Available | |
| Cook Ft | -- | -- | |
| Cook Ft | -- | -- |
Source: Public Records
Tax History
| Year | Tax Paid | Tax Assessment Tax Assessment Total Assessment is a certain percentage of the fair market value that is determined by local assessors to be the total taxable value of land and additions on the property. | Land | Improvement |
|---|---|---|---|---|
| 2025 | $7,487 | $622,900 | $171,500 | $451,400 |
| 2024 | $7,386 | $582,500 | $164,300 | $418,200 |
| 2023 | $6,734 | $486,200 | $148,700 | $337,500 |
| 2022 | $7,173 | $472,500 | $119,000 | $353,500 |
| 2021 | $4,180 | $407,500 | $119,000 | $288,500 |
| 2020 | $6,869 | $358,100 | $119,000 | $239,100 |
| 2019 | $7,475 | $324,200 | $119,000 | $205,200 |
| 2018 | $1,244 | $295,400 | $101,100 | $194,300 |
| 2017 | $4,747 | $287,700 | $89,000 | $198,700 |
| 2016 | $4,689 | $281,100 | $89,000 | $192,100 |
| 2015 | $4,544 | $272,400 | $89,000 | $183,400 |
| 2014 | $4,465 | $264,500 | $88,200 | $176,300 |
Source: Public Records
Map
Nearby Homes
- 109 Mendon Rd
- 266 Putnam Hill Rd
- 5 Hamlets Way
- 24 Manchaug Rd
- 15 Westview Dr
- 31 Central Turnpike
- 51 Central Turnpike
- 198 Uxbridge Rd
- 5 Putnam Hill Rd
- 354 W Sutton Rd
- 186 8 Lots Rd
- 18 Lakeshore Dr
- 4 1st St
- 1 Burbank Rd
- 7 Tower Hill Rd
- 29 Winwood Rd
- 99 Burbank Rd
- 99 Burbank Road Lot 182
- 108 Mumford St
- 19 Birch St
- 178 Putnam Hill Rd
- 179 Putnam Hill Rd
- 183 Putnam Hill Rd
- 182 Putnam Hill Rd
- 169 Putnam Hill Rd
- 170 Putnam Hill Rd
- 185 Putnam Hill Rd
- 165 Putnam Hill Rd
- 186 Putnam Hill Rd
- 189 Putnam Hill Rd
- 161 Putnam Hill Rd
- 8 Medbury Ln
- 192 Putnam Hill Rd
- 191 Putnam Hill Rd
- 5 Medbury Ln
- 5 Medbury Ln
- 193 Putnam Hill Rd
- 118 Mendon Rd
- 122 Mendon Rd
- 188 Putnam Hill Rd
Your Personal Tour Guide
Ask me questions while you tour the home.