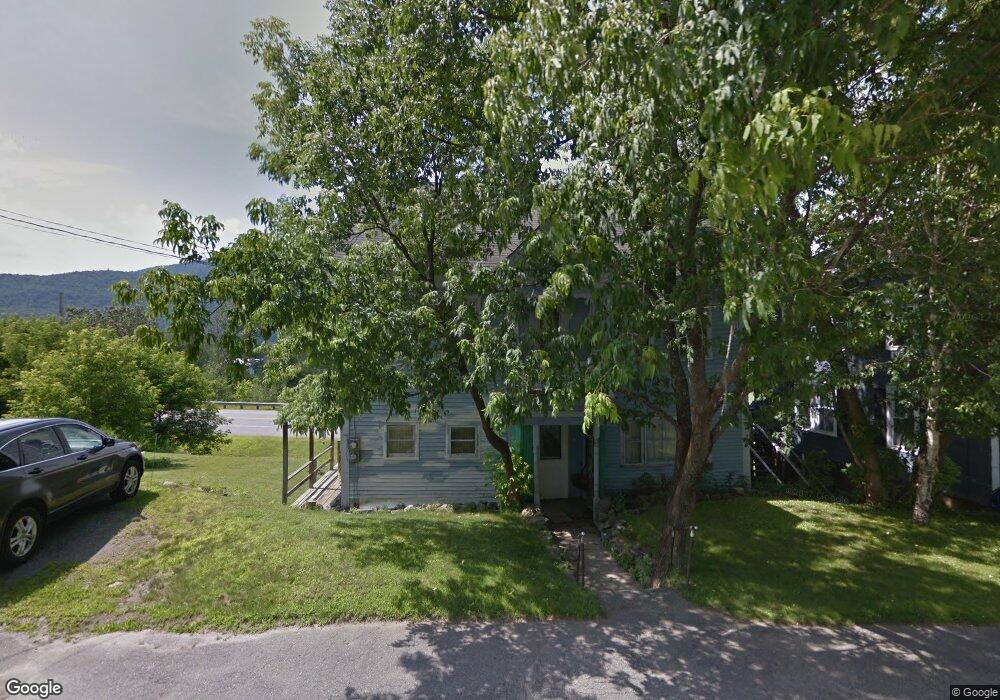
175 S Main St Colebrook, NH 03576
Estimated Value: $72,000 - $266,000
3
Beds
1
Bath
1,887
Sq Ft
$83/Sq Ft
Est. Value
About This Home
This home is located at 175 S Main St, Colebrook, NH 03576 and is currently estimated at $156,469, approximately $82 per square foot. 175 S Main St is a home located in Coos County with nearby schools including Colebrook Elementary School, Colebrook Academy, and Camp E-Toh-Anee.
Ownership History
Date
Name
Owned For
Owner Type
Purchase Details
Closed on
Jul 12, 2022
Sold by
Oneil Patrick J and Oneil Brian J
Bought by
Mackenzie Earl F
Current Estimated Value
Home Financials for this Owner
Home Financials are based on the most recent Mortgage that was taken out on this home.
Original Mortgage
$54,320
Outstanding Balance
$51,528
Interest Rate
5.09%
Mortgage Type
Purchase Money Mortgage
Estimated Equity
$104,941
Create a Home Valuation Report for This Property
The Home Valuation Report is an in-depth analysis detailing your home's value as well as a comparison with similar homes in the area
Home Values in the Area
Average Home Value in this Area
Purchase History
| Date | Buyer | Sale Price | Title Company |
|---|---|---|---|
| Mackenzie Earl F | $56,000 | None Available | |
| Mackenzie Earl F | $56,000 | None Available |
Source: Public Records
Mortgage History
| Date | Status | Borrower | Loan Amount |
|---|---|---|---|
| Open | Mackenzie Earl F | $54,320 | |
| Closed | Mackenzie Earl F | $54,320 |
Source: Public Records
Tax History Compared to Growth
Tax History
| Year | Tax Paid | Tax Assessment Tax Assessment Total Assessment is a certain percentage of the fair market value that is determined by local assessors to be the total taxable value of land and additions on the property. | Land | Improvement |
|---|---|---|---|---|
| 2024 | $1,853 | $53,000 | $11,600 | $41,400 |
| 2023 | $1,678 | $53,000 | $11,600 | $41,400 |
| 2022 | $1,501 | $53,000 | $11,600 | $41,400 |
| 2021 | $1,554 | $53,000 | $11,600 | $41,400 |
| 2020 | $1,472 | $53,000 | $11,600 | $41,400 |
| 2019 | $1,597 | $53,000 | $11,600 | $41,400 |
| 2018 | $1,745 | $57,900 | $11,600 | $46,300 |
| 2017 | $1,707 | $57,900 | $11,600 | $46,300 |
| 2016 | $1,651 | $57,900 | $11,600 | $46,300 |
| 2015 | $1,673 | $57,900 | $11,600 | $46,300 |
| 2014 | $1,676 | $57,900 | $11,600 | $46,300 |
| 2013 | $1,486 | $64,400 | $13,400 | $51,000 |
Source: Public Records
Map
Nearby Homes