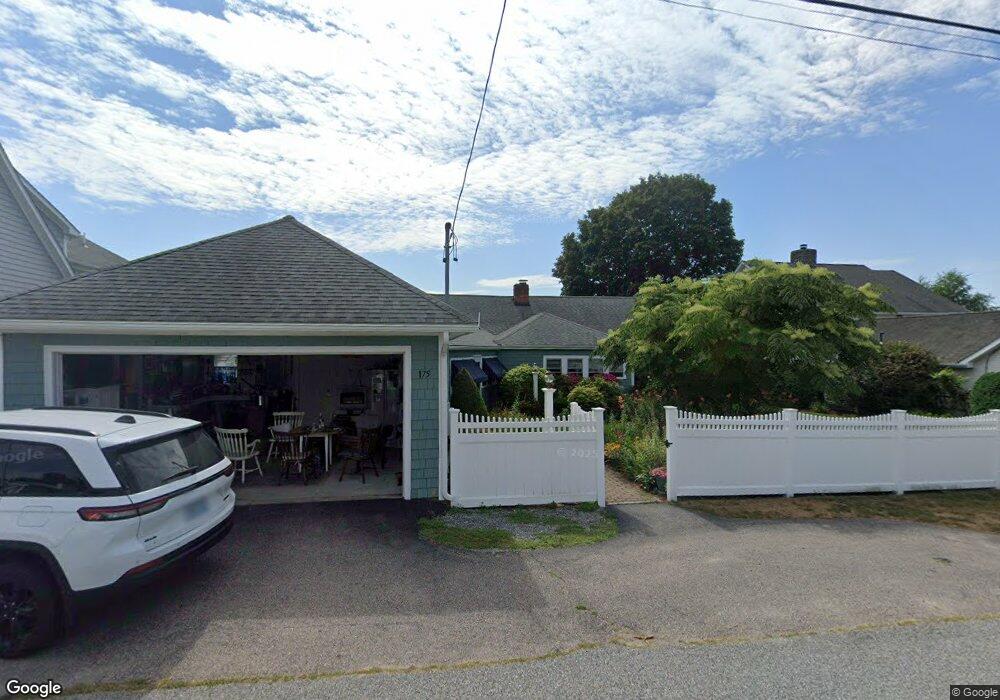
175 Sauga Ave North Kingstown, RI 02852
Wickford NeighborhoodEstimated Value: $1,149,152 - $1,615,000
3
Beds
2
Baths
1,704
Sq Ft
$772/Sq Ft
Est. Value
About This Home
This home is located at 175 Sauga Ave, North Kingstown, RI 02852 and is currently estimated at $1,316,288, approximately $772 per square foot. 175 Sauga Ave is a home located in Washington County with nearby schools including Fishing Cove Elementary School, Davisville Middle School, and North Kingstown Sr. High School.
Ownership History
Date
Name
Owned For
Owner Type
Purchase Details
Closed on
Jun 21, 2023
Sold by
Njoes Barry G and Njoes Marilyn S
Bought by
Njoes Barry G and Njoes S M
Current Estimated Value
Purchase Details
Closed on
Mar 23, 1998
Sold by
Brett Marie and Brett Marjorie
Bought by
Njoes Barry G and Njoes Marilyn
Create a Home Valuation Report for This Property
The Home Valuation Report is an in-depth analysis detailing your home's value as well as a comparison with similar homes in the area
Home Values in the Area
Average Home Value in this Area
Purchase History
| Date | Buyer | Sale Price | Title Company |
|---|---|---|---|
| Njoes Barry G | -- | None Available | |
| Njoes Barry G | $248,000 | -- |
Source: Public Records
Mortgage History
| Date | Status | Borrower | Loan Amount |
|---|---|---|---|
| Previous Owner | Njoes Barry G | $200,000 | |
| Previous Owner | Njoes Barry G | $182,000 | |
| Previous Owner | Njoes Barry G | $132,400 |
Source: Public Records
Tax History Compared to Growth
Tax History
| Year | Tax Paid | Tax Assessment Tax Assessment Total Assessment is a certain percentage of the fair market value that is determined by local assessors to be the total taxable value of land and additions on the property. | Land | Improvement |
|---|---|---|---|---|
| 2025 | $13,343 | $1,208,600 | $886,300 | $322,300 |
| 2024 | $13,128 | $915,500 | $739,000 | $176,500 |
| 2023 | $13,128 | $915,500 | $739,000 | $176,500 |
| 2022 | $12,872 | $915,500 | $739,000 | $176,500 |
| 2021 | $12,156 | $694,600 | $497,700 | $196,900 |
| 2020 | $11,871 | $694,600 | $497,700 | $196,900 |
| 2019 | $11,871 | $694,600 | $497,700 | $196,900 |
| 2018 | $12,683 | $668,600 | $519,400 | $149,200 |
| 2017 | $12,429 | $668,600 | $519,400 | $149,200 |
| 2016 | $12,075 | $668,600 | $519,400 | $149,200 |
| 2015 | $11,765 | $609,600 | $486,900 | $122,700 |
| 2014 | $10,775 | $609,600 | $486,900 | $122,700 |
Source: Public Records
Map
Nearby Homes