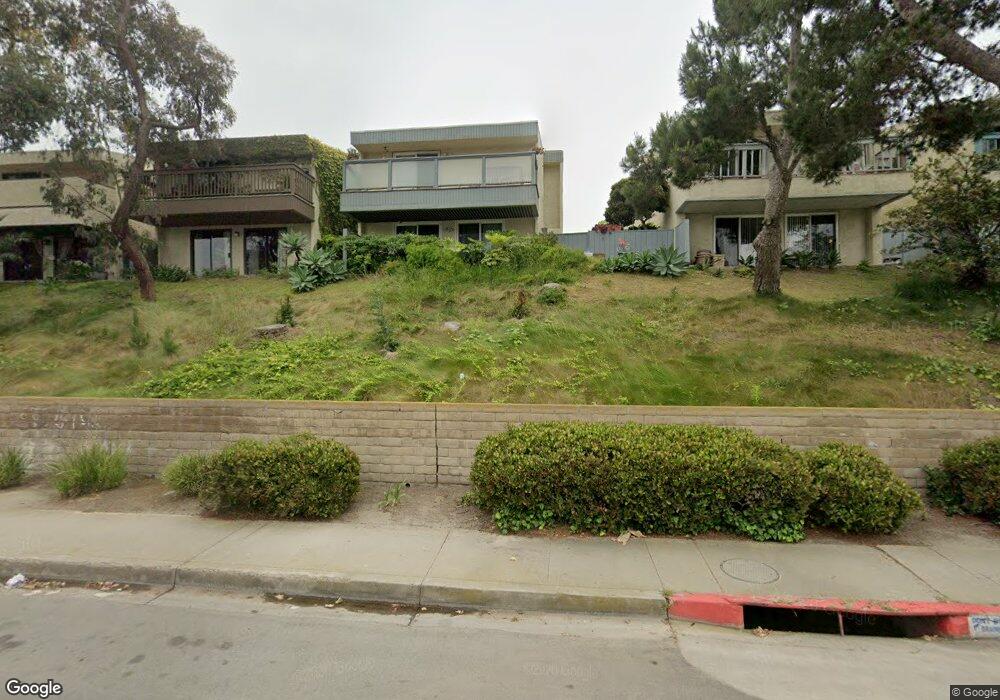
175 Seaspray Way Port Hueneme, CA 93041
Estimated Value: $847,000 - $1,120,000
3
Beds
3
Baths
1,544
Sq Ft
$615/Sq Ft
Est. Value
About This Home
This home is located at 175 Seaspray Way, Port Hueneme, CA 93041 and is currently estimated at $948,828, approximately $614 per square foot. 175 Seaspray Way is a home located in Ventura County with nearby schools including Hueneme Elementary and Hueneme High School.
Ownership History
Date
Name
Owned For
Owner Type
Purchase Details
Closed on
Jun 30, 2010
Sold by
Miller James W and Miller Arnita M
Bought by
Miller James W and Miller Arnita M
Current Estimated Value
Purchase Details
Closed on
Jan 10, 2000
Sold by
Jan Blake
Bought by
Miller James W and Miller Arnita M
Home Financials for this Owner
Home Financials are based on the most recent Mortgage that was taken out on this home.
Original Mortgage
$150,000
Interest Rate
7.96%
Purchase Details
Closed on
Jan 21, 1999
Sold by
Khan Rodney V
Bought by
Blake Jan
Purchase Details
Closed on
Jan 8, 1999
Sold by
Jan Blake and Blake Christine
Bought by
Blake Jan
Purchase Details
Closed on
Jan 23, 1998
Sold by
Jan Blake
Bought by
Blake Jan and Blake Christine
Create a Home Valuation Report for This Property
The Home Valuation Report is an in-depth analysis detailing your home's value as well as a comparison with similar homes in the area
Home Values in the Area
Average Home Value in this Area
Purchase History
| Date | Buyer | Sale Price | Title Company |
|---|---|---|---|
| Miller James W | -- | None Available | |
| Miller James W | $330,000 | American Title Co | |
| Blake Jan | -- | American Title Co | |
| Blake Jan | -- | American Title Co | |
| Blake Jan | -- | -- | |
| Blake Jan | -- | -- |
Source: Public Records
Mortgage History
| Date | Status | Borrower | Loan Amount |
|---|---|---|---|
| Closed | Miller James W | $150,000 |
Source: Public Records
Tax History Compared to Growth
Tax History
| Year | Tax Paid | Tax Assessment Tax Assessment Total Assessment is a certain percentage of the fair market value that is determined by local assessors to be the total taxable value of land and additions on the property. | Land | Improvement |
|---|---|---|---|---|
| 2025 | $5,958 | $507,016 | $202,801 | $304,215 |
| 2024 | $5,958 | $497,075 | $198,825 | $298,250 |
| 2023 | $5,664 | $487,329 | $194,927 | $292,402 |
| 2022 | $5,504 | $477,774 | $191,105 | $286,669 |
| 2021 | $5,501 | $468,406 | $187,357 | $281,049 |
| 2020 | $5,435 | $463,605 | $185,437 | $278,168 |
| 2019 | $5,359 | $454,515 | $181,801 | $272,714 |
| 2018 | $5,181 | $445,604 | $178,237 | $267,367 |
| 2017 | $4,992 | $436,868 | $174,743 | $262,125 |
| 2016 | $4,843 | $428,303 | $171,317 | $256,986 |
| 2015 | $4,722 | $421,872 | $168,745 | $253,127 |
| 2014 | $4,673 | $413,610 | $165,441 | $248,169 |
Source: Public Records
Map
Nearby Homes
- 137 Mainsail Ct
- 240 E Surfside Dr
- 209 S Ventura Rd Unit 31
- 277 E Surfside Dr
- 225 S Ventura Rd Unit 86
- 225 S Ventura Rd Unit 102
- 225 S Ventura Rd Unit 79
- 201 S Ventura Rd Unit 15
- 558 Terrace View Place
- 618 Island View Cir Unit 618
- 470 Sanddollar Ln
- 664 Beachport Dr
- 303 Blue Dolphin Dr
- 509 4th Place
- 705 Ocean View Dr Unit 705A
- 660 Sunfish Way
- 632 Joyce Dr
- 755 Ocean Breeze Dr
- 761 Reef Cir
- 117 Ann Ave
- 179 Seaspray Way
- 171 Seaspray Way
- 183 Seaspray Way
- 167 Seaspray Way
- 187 Seaspray Way
- 163 Seaspray Way
- 191 Seaspray Way
- 159 Seaspray Way
- 170 Seaspray Way
- 182 Seaspray Way
- 166 Seaspray Way
- 186 Seaspray Way
- 164 Seaspray Way
- 155 Seaspray Way
- 195 Seaspray Way
- 190 Seaspray Way
- 160 Seaspray Way
- 151 Seaspray Way
- 248 Whitecap Ct
- 156 Seaspray Way