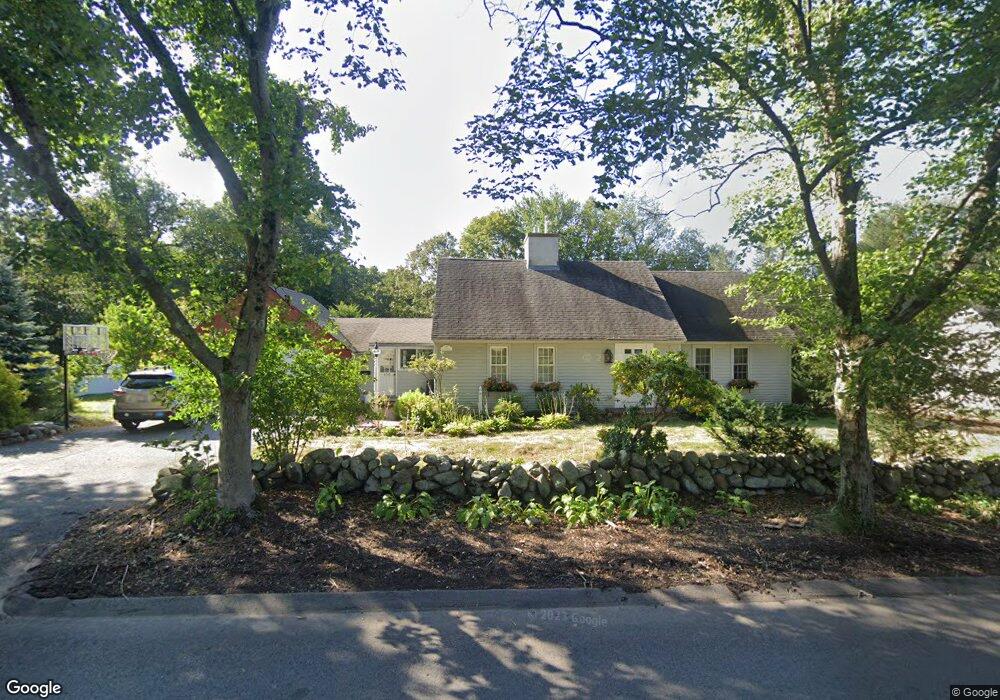
175 Summer St Andover, MA 01810
East Andover NeighborhoodEstimated Value: $958,000 - $1,091,000
4
Beds
2
Baths
2,001
Sq Ft
$508/Sq Ft
Est. Value
About This Home
This home is located at 175 Summer St, Andover, MA 01810 and is currently estimated at $1,015,820, approximately $507 per square foot. 175 Summer St is a home located in Essex County with nearby schools including Bancroft Elementary School, Doherty Middle School, and Andover High School.
Ownership History
Date
Name
Owned For
Owner Type
Purchase Details
Closed on
Jan 13, 2010
Sold by
Dearborn David C and Dearborn Brent Deborah
Bought by
Livermore Ralph W and Livermore Judianne
Current Estimated Value
Home Financials for this Owner
Home Financials are based on the most recent Mortgage that was taken out on this home.
Original Mortgage
$364,000
Interest Rate
4.71%
Mortgage Type
Purchase Money Mortgage
Purchase Details
Closed on
Aug 21, 2008
Sold by
Dearborn Dorothy W
Bought by
Dearborn David C and Dearborn Peter E
Create a Home Valuation Report for This Property
The Home Valuation Report is an in-depth analysis detailing your home's value as well as a comparison with similar homes in the area
Home Values in the Area
Average Home Value in this Area
Purchase History
| Date | Buyer | Sale Price | Title Company |
|---|---|---|---|
| Livermore Ralph W | $455,000 | -- | |
| Livermore Ralph W | $455,000 | -- | |
| Dearborn David C | -- | -- | |
| Dearborn David C | -- | -- |
Source: Public Records
Mortgage History
| Date | Status | Borrower | Loan Amount |
|---|---|---|---|
| Open | Dearborn David C | $354,000 | |
| Closed | Livermore Ralph W | $364,000 |
Source: Public Records
Tax History
| Year | Tax Paid | Tax Assessment Tax Assessment Total Assessment is a certain percentage of the fair market value that is determined by local assessors to be the total taxable value of land and additions on the property. | Land | Improvement |
|---|---|---|---|---|
| 2024 | $10,629 | $825,200 | $510,200 | $315,000 |
| 2023 | $10,163 | $744,000 | $459,600 | $284,400 |
| 2022 | $9,728 | $666,300 | $406,800 | $259,500 |
| 2021 | $9,298 | $608,100 | $369,700 | $238,400 |
| 2020 | $8,916 | $594,000 | $360,800 | $233,200 |
| 2019 | $8,763 | $573,900 | $346,700 | $227,200 |
| 2018 | $8,385 | $536,100 | $327,000 | $209,100 |
| 2017 | $8,012 | $527,800 | $320,500 | $207,300 |
| 2016 | $7,822 | $527,800 | $320,500 | $207,300 |
| 2015 | $7,542 | $503,800 | $308,300 | $195,500 |
Source: Public Records
Map
Nearby Homes
- 1 Stratford Rd
- 81 Chestnut St Unit 81
- 46 Whittier St
- 33 Chestnut St Unit 2
- 62 Carmel Rd
- 100.5 Main St Unit Q
- 96 N Main St Unit 3
- 154 Main St
- 36 High St
- 52 Salem St
- 49 Salem St
- 1 Sweeney Ct
- 181 High St Unit 1
- 57 Salem St
- 124 Quail Run Rd
- 136 Quail Run Rd
- 170 Haverhill St Unit 138
- 1 Longwood Dr Unit 5 (109)
- 3 Longwood Dr Unit 107
- 36 Kieran Rd
- 171 Summer St
- 179 Summer St
- 12 Rogers Brook W
- 8 Rogers Brook E
- 10 Rogers Brook W
- 174 Summer St
- 169 Summer St
- 169 Summer St Unit n/a
- 183 Summer St
- 172 Summer St
- 5 Rogers Brook E
- 182 Summer St
- 170 Summer St
- 13 Rogers Brook W
- 167 Summer St
- 167 Summer St Unit 167
- 186 Summer St
- 187 Summer St
- 6 Rogers Brook E
- 11 Rogers Brook W
Your Personal Tour Guide
Ask me questions while you tour the home.