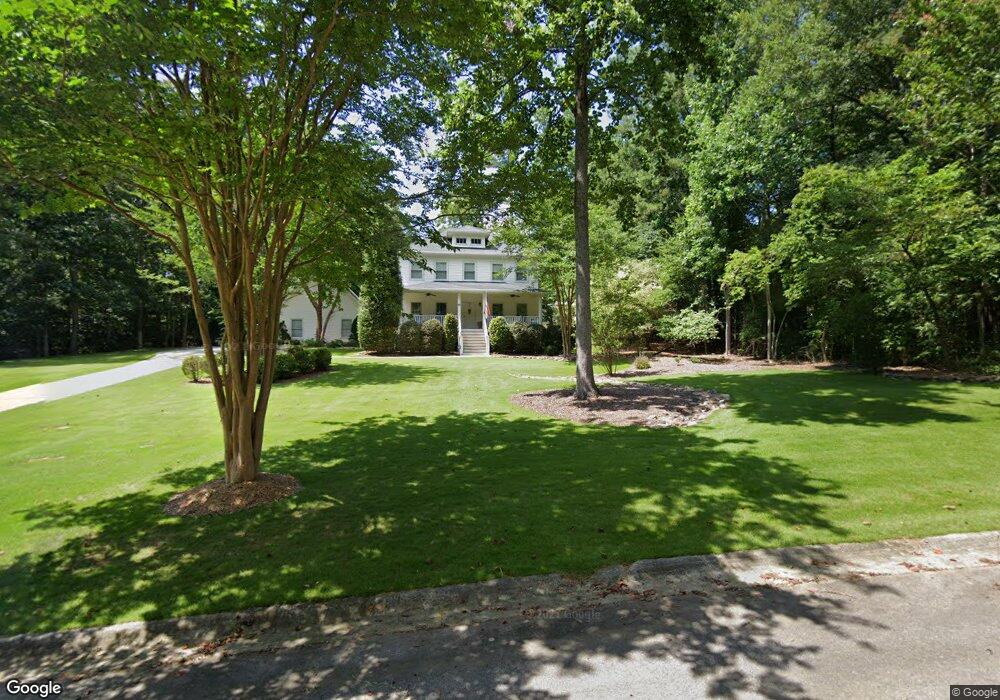
175 Taylor Ridge Ct Unit 1 Acre Tyrone, GA 30290
Estimated Value: $500,706 - $587,000
4
Beds
3
Baths
2,448
Sq Ft
$223/Sq Ft
Est. Value
About This Home
This home is located at 175 Taylor Ridge Ct Unit 1 Acre, Tyrone, GA 30290 and is currently estimated at $545,677, approximately $222 per square foot. 175 Taylor Ridge Ct Unit 1 Acre is a home located in Fayette County with nearby schools including Crabapple Lane Elementary School, Flat Rock Middle School, and Sandy Creek High School.
Ownership History
Date
Name
Owned For
Owner Type
Purchase Details
Closed on
Oct 22, 2020
Sold by
Lackey Alan G
Bought by
Chipman Jonathan and Chipman Joanna
Current Estimated Value
Home Financials for this Owner
Home Financials are based on the most recent Mortgage that was taken out on this home.
Original Mortgage
$370,500
Outstanding Balance
$328,794
Interest Rate
2.9%
Mortgage Type
New Conventional
Estimated Equity
$216,883
Purchase Details
Closed on
May 22, 1995
Sold by
Law Bldrs
Bought by
Lackey Alan Jacquelyn
Purchase Details
Closed on
Sep 29, 1994
Sold by
Richardson John
Bought by
Law Bldrs
Home Financials for this Owner
Home Financials are based on the most recent Mortgage that was taken out on this home.
Original Mortgage
$146,250
Interest Rate
8.56%
Mortgage Type
Construction
Create a Home Valuation Report for This Property
The Home Valuation Report is an in-depth analysis detailing your home's value as well as a comparison with similar homes in the area
Home Values in the Area
Average Home Value in this Area
Purchase History
| Date | Buyer | Sale Price | Title Company |
|---|---|---|---|
| Chipman Jonathan | $390,000 | -- | |
| Lackey Alan Jacquelyn | $170,900 | -- | |
| Law Bldrs | $27,400 | -- |
Source: Public Records
Mortgage History
| Date | Status | Borrower | Loan Amount |
|---|---|---|---|
| Open | Chipman Jonathan | $370,500 | |
| Previous Owner | Law Bldrs | $146,250 | |
| Closed | Lackey Alan Jacquelyn | $0 |
Source: Public Records
Tax History Compared to Growth
Tax History
| Year | Tax Paid | Tax Assessment Tax Assessment Total Assessment is a certain percentage of the fair market value that is determined by local assessors to be the total taxable value of land and additions on the property. | Land | Improvement |
|---|---|---|---|---|
| 2024 | $4,102 | $168,540 | $30,000 | $138,540 |
| 2023 | $3,620 | $161,720 | $30,000 | $131,720 |
| 2022 | $3,959 | $156,400 | $30,000 | $126,400 |
| 2021 | $3,696 | $135,040 | $30,000 | $105,040 |
| 2020 | $2,847 | $137,040 | $23,400 | $113,640 |
| 2019 | $2,451 | $117,120 | $23,400 | $93,720 |
| 2018 | $2,321 | $110,120 | $23,400 | $86,720 |
| 2017 | $2,269 | $107,160 | $23,400 | $83,760 |
| 2016 | $2,101 | $97,040 | $23,400 | $73,640 |
| 2015 | $2,851 | $89,640 | $23,400 | $66,240 |
| 2014 | $2,554 | $79,360 | $23,400 | $55,960 |
| 2013 | -- | $77,120 | $0 | $0 |
Source: Public Records
Map
Nearby Homes
- 140 Devonshire Place
- 160 Wickham Dr
- 255 Cicely Way
- 110 Sutton Ct
- Lot 3 Dogwood Trail Unit 5 ACRES
- 125 Farr Lake Dr
- 230 Hedgewick Way
- 250 Chimney Springs
- 115 Rockhurst Chase
- 140 Julie Rd
- 159 Sims Rd
- 230 Smokerise Trace
- 240 Lynnwood Ave
- 0 Erwin Run Unit 10585589
- 100 Leisure Trail
- 300 Abercorn Square
- 115 Cottage Grove
- 301 Abercorn Square
- 100 Smokerise Trace
- 365 Pendleton Trail
- 175 Taylor Ridge Ct
- 185 Taylor Ridge Ct
- 160 Natures Path
- 170 Natures Path
- 150 Natures Path
- 165 Taylor Ridge Ct
- 220 Brayden Dr
- 195 Taylor Ridge Ct
- 210 Brayden Dr
- 180 Natures Path
- 230 Brayden Dr
- 200 Brayden Dr
- 155 Taylor Ridge Ct
- 140 Natures Path Unit 16
- 140 Natures Path
- 145 Natures Path
- 155 Natures Path
- 190 Natures Path
- 190 Brayden Dr
- 135 Natures Path