Estimated Value: $287,295 - $314,000
4
Beds
2
Baths
1,188
Sq Ft
$253/Sq Ft
Est. Value
About This Home
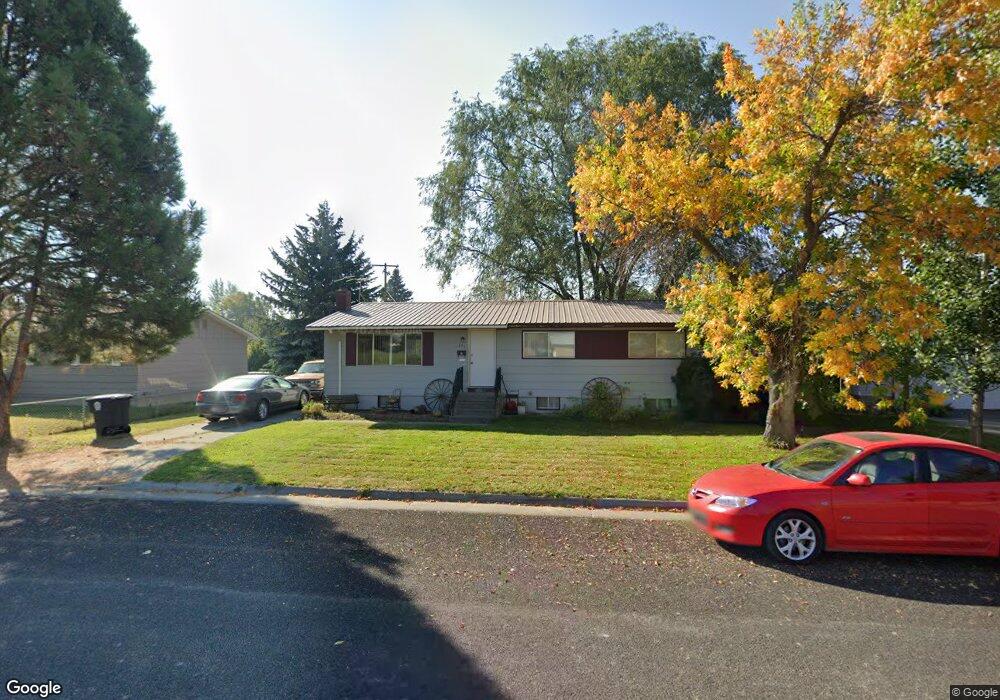
This home is located at 175 W 3rd N, Rigby, ID 83442 and is currently estimated at $300,074, approximately $252 per square foot. 175 W 3rd N is a home located in Jefferson County with nearby schools including Harwood Elementary School, Rigby Middle School, and Rigby High School.
Ownership History
Date
Name
Owned For
Owner Type
Purchase Details
Closed on
Aug 17, 2010
Sold by
Federal National Mortgage Association
Bought by
Parke W Jay
Current Estimated Value
Home Financials for this Owner
Home Financials are based on the most recent Mortgage that was taken out on this home.
Original Mortgage
$91,180
Outstanding Balance
$59,506
Interest Rate
4.52%
Mortgage Type
New Conventional
Estimated Equity
$240,568
Purchase Details
Closed on
Aug 2, 2010
Sold by
Hill Matthew and Hill Colette
Bought by
Marler Ryan
Home Financials for this Owner
Home Financials are based on the most recent Mortgage that was taken out on this home.
Original Mortgage
$91,180
Outstanding Balance
$59,506
Interest Rate
4.52%
Mortgage Type
New Conventional
Estimated Equity
$240,568
Create a Home Valuation Report for This Property
The Home Valuation Report is an in-depth analysis detailing your home's value as well as a comparison with similar homes in the area
Home Values in the Area
Average Home Value in this Area
Purchase History
| Date | Buyer | Sale Price | Title Company |
|---|---|---|---|
| Parke W Jay | -- | -- | |
| Marler Ryan | -- | -- |
Source: Public Records
Mortgage History
| Date | Status | Borrower | Loan Amount |
|---|---|---|---|
| Open | Parke W Jay | $91,180 | |
| Closed | Marler Ryan | $87,481 |
Source: Public Records
Tax History
| Year | Tax Paid | Tax Assessment Tax Assessment Total Assessment is a certain percentage of the fair market value that is determined by local assessors to be the total taxable value of land and additions on the property. | Land | Improvement |
|---|---|---|---|---|
| 2025 | $21 | $224,994 | $0 | $0 |
| 2024 | $21 | $217,355 | $0 | $0 |
| 2023 | $21 | $224,786 | $0 | $0 |
| 2022 | $1,274 | $203,417 | $0 | $0 |
| 2021 | $1,295 | $157,783 | $0 | $0 |
| 2020 | $1,019 | $142,291 | $0 | $0 |
| 2019 | $21 | $116,665 | $0 | $0 |
| 2018 | $1,010 | $102,330 | $0 | $0 |
| 2017 | $1,045 | $101,390 | $0 | $0 |
| 2016 | $21 | $50,224 | $0 | $0 |
| 2015 | $1,017 | $46,734 | $0 | $0 |
| 2014 | $957 | $44,021 | $0 | $0 |
| 2013 | -- | $41,888 | $0 | $0 |
Source: Public Records
Map
Nearby Homes
- 267 N State St
- 315 Ramona Ave
- 263 W 2nd N
- 339 Ramona Ave
- 351 Estella Ave
- 555 Bitter Root St
- 567 Bitter Root St
- 556 Syringa St
- 350 N 3rd St W
- 582 Syringa St
- 359 N 3rd W Unit 203
- TBD Lot 1 Clearwaterway
- 3761 E 361 N
- L10 B5 N 3731 E
- L5 B4 N 3730 E
- L13 B5 N 3731 E
- L10 B4 N 3730 E
- L8 B4 N 3730 E
- TBD Lot 6 Lemhi Ave
- 86 Hillside Rd
Your Personal Tour Guide
Ask me questions while you tour the home.