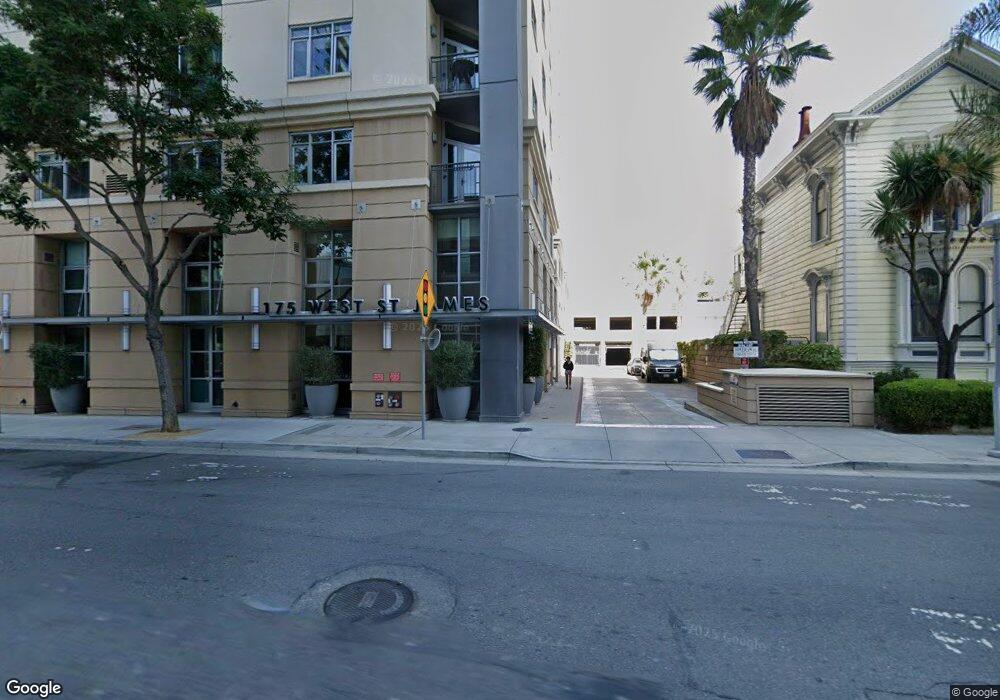
175 W St James St Unit 305 San Jose, CA 95110
Downtown San Jose NeighborhoodEstimated Value: $536,000 - $887,000
1
Bed
1
Bath
904
Sq Ft
$704/Sq Ft
Est. Value
About This Home
This home is located at 175 W St James St Unit 305, San Jose, CA 95110 and is currently estimated at $636,820, approximately $704 per square foot. 175 W St James St Unit 305 is a home located in Santa Clara County with nearby schools including Horace Mann Elementary School, Herbert Hoover Middle School, and Abraham Lincoln High.
Ownership History
Date
Name
Owned For
Owner Type
Purchase Details
Closed on
Aug 13, 2019
Sold by
Lee Adam Y
Bought by
Lee Isabel Hsin Jung
Current Estimated Value
Home Financials for this Owner
Home Financials are based on the most recent Mortgage that was taken out on this home.
Original Mortgage
$495,000
Outstanding Balance
$433,529
Interest Rate
3.7%
Mortgage Type
New Conventional
Estimated Equity
$203,291
Purchase Details
Closed on
Jan 9, 2018
Sold by
Sohal Santokh and Sohal Paramjit
Bought by
Lee Isabel Hsin Jung and Lee Adam Y
Home Financials for this Owner
Home Financials are based on the most recent Mortgage that was taken out on this home.
Original Mortgage
$504,000
Interest Rate
3.9%
Mortgage Type
New Conventional
Purchase Details
Closed on
Jun 13, 2007
Sold by
City Heights Development Lp
Bought by
Sohal Santokh and Sohal Paramjit
Home Financials for this Owner
Home Financials are based on the most recent Mortgage that was taken out on this home.
Original Mortgage
$378,000
Interest Rate
5.5%
Mortgage Type
Purchase Money Mortgage
Create a Home Valuation Report for This Property
The Home Valuation Report is an in-depth analysis detailing your home's value as well as a comparison with similar homes in the area
Home Values in the Area
Average Home Value in this Area
Purchase History
| Date | Buyer | Sale Price | Title Company |
|---|---|---|---|
| Lee Isabel Hsin Jung | $247,500 | Fidelity National Title Co | |
| Lee Isabel Hsin Jung | $630,000 | Chicago Title Co | |
| Sohal Santokh | $420,000 | First American Title Co |
Source: Public Records
Mortgage History
| Date | Status | Borrower | Loan Amount |
|---|---|---|---|
| Open | Lee Isabel Hsin Jung | $495,000 | |
| Previous Owner | Lee Isabel Hsin Jung | $504,000 | |
| Previous Owner | Sohal Santokh | $378,000 |
Source: Public Records
Tax History Compared to Growth
Tax History
| Year | Tax Paid | Tax Assessment Tax Assessment Total Assessment is a certain percentage of the fair market value that is determined by local assessors to be the total taxable value of land and additions on the property. | Land | Improvement |
|---|---|---|---|---|
| 2025 | $6,894 | $570,000 | $285,000 | $285,000 |
| 2024 | $6,894 | $550,000 | $275,000 | $275,000 |
| 2023 | $8,854 | $720,292 | $360,146 | $360,146 |
| 2022 | $8,795 | $706,170 | $353,085 | $353,085 |
| 2021 | $8,642 | $692,324 | $346,162 | $346,162 |
| 2020 | $8,497 | $685,226 | $342,613 | $342,613 |
| 2019 | $7,998 | $642,600 | $321,300 | $321,300 |
| 2018 | $6,301 | $484,845 | $315,150 | $169,695 |
| 2017 | $6,255 | $475,339 | $308,971 | $166,368 |
| 2016 | $6,116 | $466,019 | $302,913 | $163,106 |
| 2015 | $5,987 | $452,000 | $293,800 | $158,200 |
| 2014 | $5,334 | $398,000 | $258,700 | $139,300 |
Source: Public Records
Map
Nearby Homes
- 175 W Saint James St Unit 1305
- 175 W Saint James St Unit 203
- 188 W Saint James St Unit 11101
- 238 Element Rd
- 254 Terraine St
- 1 E Julian St Unit 113
- 30 E Julian St Unit 206
- 30 E Julian St Unit 307
- 38 N Almaden Blvd Unit 2001
- 38 N Almaden Blvd Unit 506
- 38 N Almaden Blvd Unit 1220
- 38 N Almaden Blvd Unit 1013
- 38 N Almaden Blvd Unit 1303
- 38 N Almaden Blvd Unit 1115
- 1 1
- 97 E Saint James St Unit 26
- 97 E Saint James St Unit 51
- 97 E Saint James St Unit 41
- 400 N 1st St Unit 303
- 350 N 2nd St Unit 342
- 175 W St James St Unit 507
- 175 W St James St Unit 110
- 175 W St James St Unit 703
- 175 W St James St Unit 906
- 175 W St James St Unit 1006
- 175 W St James St
- 175 W St James St Unit 1207
- 175 W St James St Unit 306
- 175 W James St
- 175 W James St Unit 305
- 175 W 175 West James St Unit 305
- 175 W Saint James St
- 175 W Saint James St
- 175 W Saint James St Unit STOR
- 175 W Saint James St Unit 1509
- 175 W Saint James St Unit 1508
- 175 W Saint James St Unit 1507
- 175 W Saint James St Unit 1506
- 175 W Saint James St Unit 1505
- 175 W Saint James St Unit 1503