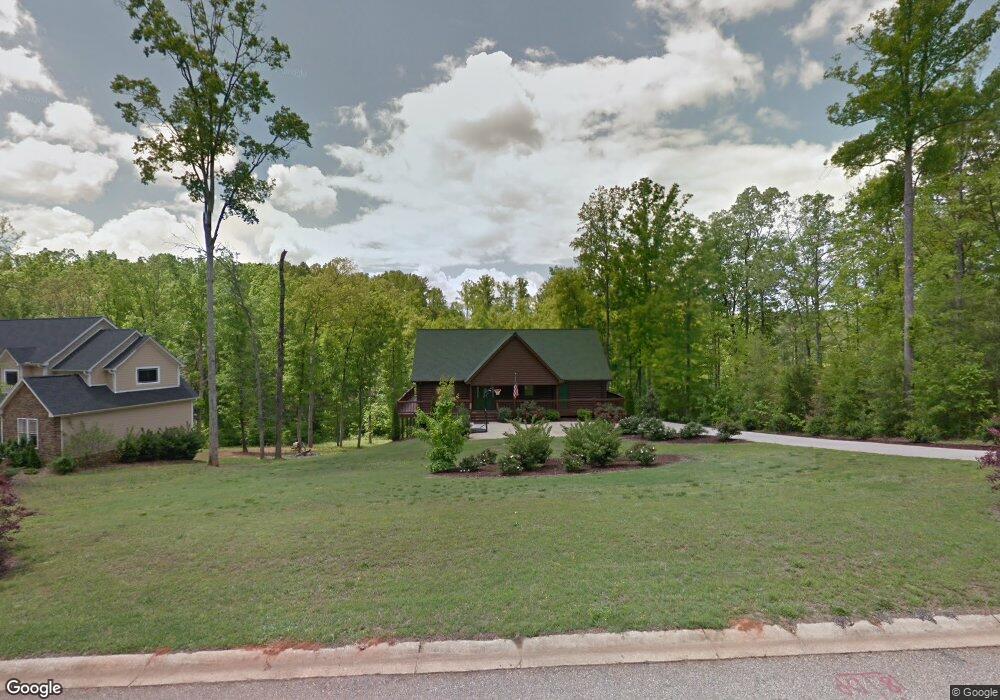
175 W Waters Edge Ln West Union, SC 29696
Estimated Value: $439,219 - $732,000
5
Beds
3
Baths
3,328
Sq Ft
$163/Sq Ft
Est. Value
About This Home
This home is located at 175 W Waters Edge Ln, West Union, SC 29696 and is currently estimated at $542,305, approximately $162 per square foot. 175 W Waters Edge Ln is a home located in Oconee County with nearby schools including Keowee Elementary School, Walhalla Middle School, and Walhalla High School.
Ownership History
Date
Name
Owned For
Owner Type
Purchase Details
Closed on
Jan 15, 2015
Sold by
Wood Bobby Hugh Dean
Bought by
Witzel Kenneth A and Witzel Jennie L
Current Estimated Value
Home Financials for this Owner
Home Financials are based on the most recent Mortgage that was taken out on this home.
Original Mortgage
$60,000
Interest Rate
3.98%
Mortgage Type
Seller Take Back
Purchase Details
Closed on
May 2, 2013
Sold by
Wood Bobby H and Wood Frances Dianne
Bought by
Wood Bobby Hugh Dean and Bobby H Wood Revocable Trust
Purchase Details
Closed on
Jul 26, 2011
Sold by
Young John R
Bought by
Wood Bobby H and Wood Frances Dianne
Purchase Details
Closed on
Nov 18, 2008
Sold by
Blue Ridge Savings Bank Inc
Bought by
Young John R
Purchase Details
Closed on
Jun 30, 2008
Sold by
Stancil Larry K and Stancil Jane S
Bought by
Blue Ridge Savings Bank Inc
Create a Home Valuation Report for This Property
The Home Valuation Report is an in-depth analysis detailing your home's value as well as a comparison with similar homes in the area
Home Values in the Area
Average Home Value in this Area
Purchase History
| Date | Buyer | Sale Price | Title Company |
|---|---|---|---|
| Witzel Kenneth A | $210,000 | -- | |
| Wood Bobby Hugh Dean | -- | -- | |
| Wood Bobby H | $250,000 | -- | |
| Young John R | $185,000 | -- | |
| Blue Ridge Savings Bank Inc | -- | -- |
Source: Public Records
Mortgage History
| Date | Status | Borrower | Loan Amount |
|---|---|---|---|
| Closed | Witzel Kenneth A | $60,000 |
Source: Public Records
Tax History Compared to Growth
Tax History
| Year | Tax Paid | Tax Assessment Tax Assessment Total Assessment is a certain percentage of the fair market value that is determined by local assessors to be the total taxable value of land and additions on the property. | Land | Improvement |
|---|---|---|---|---|
| 2025 | $969 | $9,235 | $497 | $8,738 |
| 2024 | $969 | $9,235 | $497 | $8,738 |
| 2023 | $982 | $9,235 | $497 | $8,738 |
| 2022 | $982 | $9,235 | $497 | $8,738 |
| 2021 | $921 | $8,784 | $497 | $8,287 |
| 2020 | $977 | $8,784 | $497 | $8,287 |
| 2019 | $977 | $0 | $0 | $0 |
| 2018 | $1,948 | $0 | $0 | $0 |
| 2017 | $921 | $0 | $0 | $0 |
| 2016 | $921 | $0 | $0 | $0 |
| 2015 | -- | $0 | $0 | $0 |
| 2014 | -- | $15,000 | $3,828 | $11,173 |
| 2013 | -- | $0 | $0 | $0 |
Source: Public Records
Map
Nearby Homes
- 173 W Waters Edge Ln
- 141 W Waters Edge Ln
- Lot 57 W Waters Edge Ln
- Lot 55 W Waters Edge Ln
- 137 W Waters Edge Ln
- 98 E W Waters Edge Ln
- 825 & 833 Armada Way
- 146 Jefferson Rd
- 147 Mcalister Rd
- 240 E Waters Edge Ln
- 625 Burns Mill Rd
- 00 Eleanore Dr
- 621 Burns Mill Rd
- Lot 61 Hardwood Pointe Dr
- 4014 Hardwood Pointe Dr
- 61 Hardwood Pointe Dr
- 115 Burns Mill Rd
- 509 Peninsula Rd
- Lot 43 Glassy Water Way
- 6004 Glassy Water Way
- 175 W Waters Edge Ln Unit LOT 60 WATERS EDGE
- 173 W Waters Edge Ln Unit LAKE KEOWEE GATED SU
- 179 W Waters Edge Ln
- LOT 62 W Waters Edge Subdivision
- 158 W Waters Edge Ln
- LOT 63 W Waters Edge Subdivision
- Lot 15 Waters Edge Subdivision
- 183 W Waters Edge Ln
- 82A3 Getaway Ln Waters Edge Ct
- 82A2 Safety Harbor D Waters Edge Ct
- Lot 32 Waters Edge Ct
- LOT 82A1 Waters Edge Ct
- Lot 48 Waters Edge Ct
- Lot 54 Waters Edge Ct Unit 163 W Waters Edge La
- 159 W Waters Edge Ln Unit WATERS EDGE
- 159 W Waters Edge Ln
- 157 W Waters Edge Ln Unit Lot 51 at Waters Edg
- 157 W Waters Edge Ln
- 155 W Waters Edge Ln
- 180 W Waters Edge Ln Unit Waters Edge