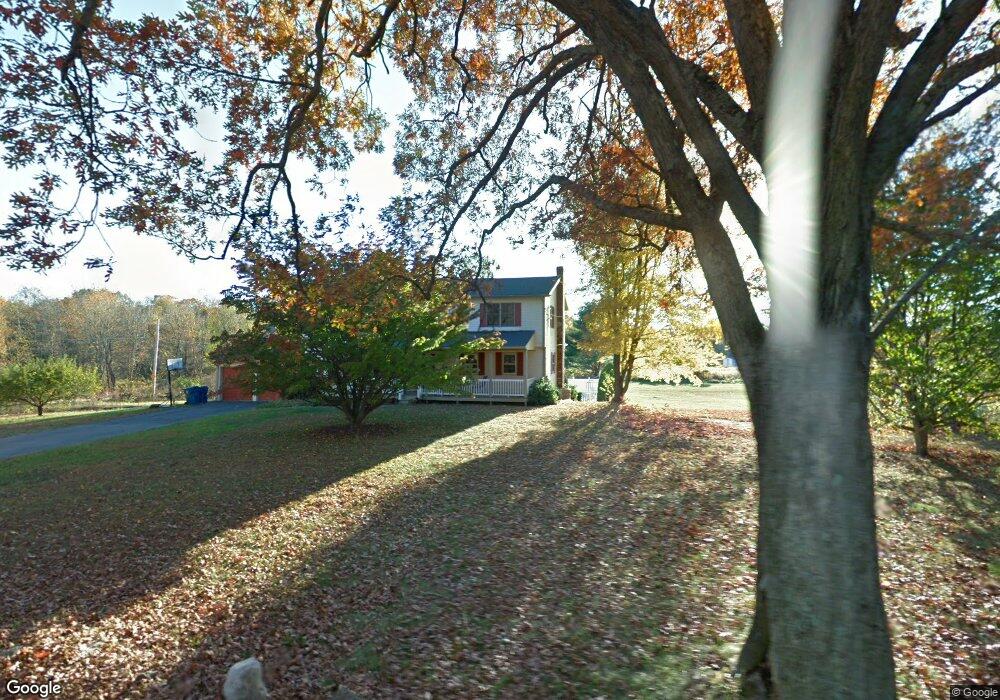
175 West St Uxbridge, MA 01569
Estimated Value: $672,672 - $822,000
5
Beds
3
Baths
3,667
Sq Ft
$208/Sq Ft
Est. Value
About This Home
This home is located at 175 West St, Uxbridge, MA 01569 and is currently estimated at $763,918, approximately $208 per square foot. 175 West St is a home located in Worcester County with nearby schools including Uxbridge High School and Our Lady of the Valley Regional School.
Ownership History
Date
Name
Owned For
Owner Type
Purchase Details
Closed on
Feb 10, 2023
Sold by
Zabinski Daniel E and Zabinski Carol A
Bought by
Zabinski Joint Ft and Zabinski
Current Estimated Value
Create a Home Valuation Report for This Property
The Home Valuation Report is an in-depth analysis detailing your home's value as well as a comparison with similar homes in the area
Home Values in the Area
Average Home Value in this Area
Purchase History
| Date | Buyer | Sale Price | Title Company |
|---|---|---|---|
| Zabinski Joint Ft | -- | None Available |
Source: Public Records
Tax History Compared to Growth
Tax History
| Year | Tax Paid | Tax Assessment Tax Assessment Total Assessment is a certain percentage of the fair market value that is determined by local assessors to be the total taxable value of land and additions on the property. | Land | Improvement |
|---|---|---|---|---|
| 2025 | $64 | $486,000 | $156,800 | $329,200 |
| 2024 | $6,032 | $466,900 | $148,800 | $318,100 |
| 2023 | $5,703 | $408,800 | $128,700 | $280,100 |
| 2022 | $5,204 | $343,300 | $112,600 | $230,700 |
| 2021 | $5,393 | $340,900 | $110,200 | $230,700 |
| 2020 | $5,529 | $330,300 | $108,600 | $221,700 |
| 2019 | $5,483 | $316,000 | $108,600 | $207,400 |
| 2018 | $5,266 | $306,700 | $108,600 | $198,100 |
| 2017 | $5,134 | $302,700 | $104,800 | $197,900 |
| 2016 | $5,301 | $301,700 | $96,700 | $205,000 |
| 2015 | $5,187 | $298,100 | $96,700 | $201,400 |
Source: Public Records
Map
Nearby Homes