Estimated Value: $230,000 - $258,000
2
Beds
1
Bath
990
Sq Ft
$245/Sq Ft
Est. Value
About This Home
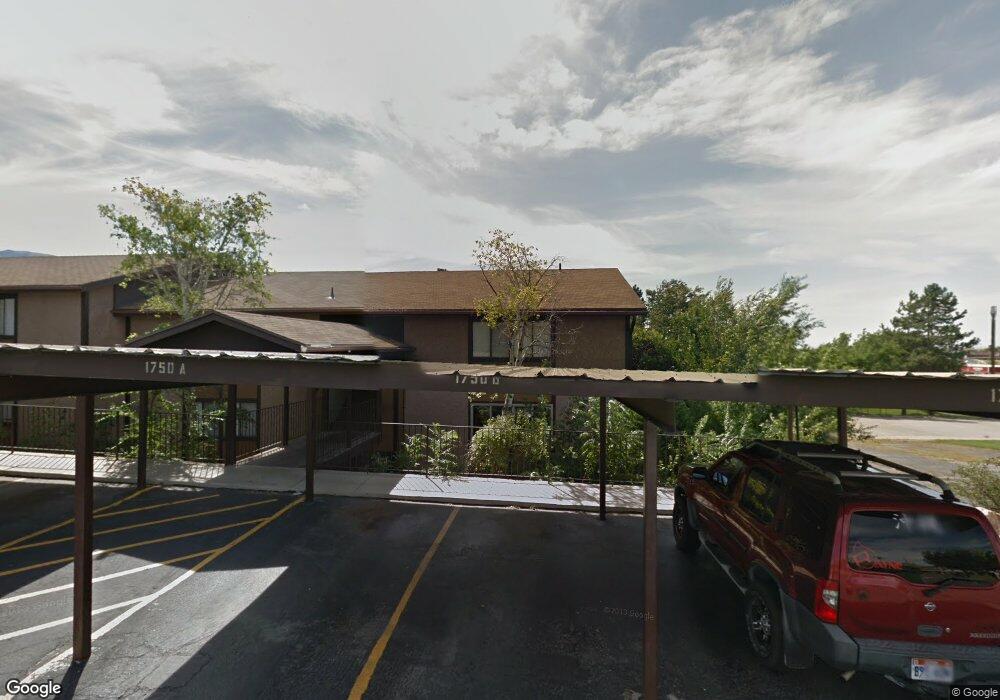
This home is located at 1750 E 5625 S Unit P1, Ogden, UT 84403 and is currently estimated at $242,425, approximately $244 per square foot. 1750 E 5625 S Unit P1 is a home located in Weber County with nearby schools including Uintah School, South Ogden Junior High School, and Bonneville High School.
Ownership History
Date
Name
Owned For
Owner Type
Purchase Details
Closed on
Oct 22, 2014
Sold by
Foulger Christine M
Bought by
Clergy Jeanne St
Current Estimated Value
Home Financials for this Owner
Home Financials are based on the most recent Mortgage that was taken out on this home.
Original Mortgage
$74,955
Outstanding Balance
$57,298
Interest Rate
4.1%
Mortgage Type
New Conventional
Estimated Equity
$185,127
Purchase Details
Closed on
Jun 16, 1999
Sold by
Wilson Wilbur D and Wilson Afton A
Bought by
Foulger Christine M
Purchase Details
Closed on
Jan 27, 1999
Sold by
Wilson Wilbur D and Wilson Afton A
Bought by
Foulger Christine M
Home Financials for this Owner
Home Financials are based on the most recent Mortgage that was taken out on this home.
Original Mortgage
$55,950
Interest Rate
6.63%
Purchase Details
Closed on
Jul 28, 1997
Sold by
Wilson Wilbur D and Wilson Afton A
Bought by
Wilbur D & Afton H Wilson Revocable Tr
Create a Home Valuation Report for This Property
The Home Valuation Report is an in-depth analysis detailing your home's value as well as a comparison with similar homes in the area
Home Values in the Area
Average Home Value in this Area
Purchase History
| Date | Buyer | Sale Price | Title Company |
|---|---|---|---|
| Clergy Jeanne St | -- | Mountain View Title | |
| Foulger Christine M | -- | Equity Title | |
| Foulger Christine M | -- | Equity Title | |
| Wilbur D & Afton H Wilson Revocable Tr | -- | -- |
Source: Public Records
Mortgage History
| Date | Status | Borrower | Loan Amount |
|---|---|---|---|
| Open | Clergy Jeanne St | $74,955 | |
| Previous Owner | Foulger Christine M | $55,950 |
Source: Public Records
Tax History
| Year | Tax Paid | Tax Assessment Tax Assessment Total Assessment is a certain percentage of the fair market value that is determined by local assessors to be the total taxable value of land and additions on the property. | Land | Improvement |
|---|---|---|---|---|
| 2025 | $1,515 | $236,300 | $50,000 | $186,300 |
| 2024 | $1,446 | $126,500 | $27,500 | $99,000 |
| 2023 | $1,298 | $113,300 | $27,500 | $85,800 |
| 2022 | $1,245 | $111,100 | $27,500 | $83,600 |
| 2021 | $937 | $141,000 | $30,000 | $111,000 |
| 2020 | $860 | $121,000 | $18,000 | $103,000 |
| 2019 | $859 | $116,000 | $18,000 | $98,000 |
| 2018 | $826 | $106,000 | $18,000 | $88,000 |
| 2017 | $685 | $85,000 | $15,000 | $70,000 |
| 2016 | $669 | $46,750 | $7,700 | $39,050 |
| 2015 | $557 | $37,950 | $7,700 | $30,250 |
| 2014 | $372 | $24,805 | $7,700 | $17,105 |
Source: Public Records
Map
Nearby Homes
- 1842 E 5625 S Unit C
- 5630 Meadow Ln Unit 172
- 5630 Meadow Ln Unit 192
- 5660 S Meadow Ln Unit 140
- 5600 Meadow Ln Unit 144
- 5600 Meadow Ln Unit 193
- 1805 E 5750 S
- 1929 E 5625 S
- 5660 S 1425 E Unit E3
- 5780 Village Way
- 5973 S South Weber Dr
- 6362 S Ray Dr Unit 109
- 65 W Glen Way Unit 127
- 7870 S 2700 E
- 944 W Columbia Ct Unit 108
- 215 E 40th S
- 938 W Motor Vu Dr Unit 208
- 6374 S Ray Dr Unit 111
- 5341 Fillmore Ave
- 5659 Fox Chase Dr
- 1750 E 5625 S Unit C
- 1750 E 5625 S Unit B
- 1750 E 5625 S Unit 2
- 1750 E 5625 S Unit A
- 1756 E 5625 S Unit C
- 1756 E 5625 S Unit B
- 1756 E 5625 S
- 1756 E 5625 S Unit A
- 1762 E 5625 S Unit C
- 1762 E 5625 S Unit B
- 1762 E 5625 S Unit 7
- 1762 E 5625 S Unit A
- 1762 E 5625 S
- 1768 E 5625 S Unit C
- 1768 E 5625 S Unit B
- 1768 E 5625 S
- 1768 E 5625 S Unit 11B
- 1768 E 5625 S Unit A
- 1751 E 5650 S
- 1753 E 5650 S Unit K2
Your Personal Tour Guide
Ask me questions while you tour the home.