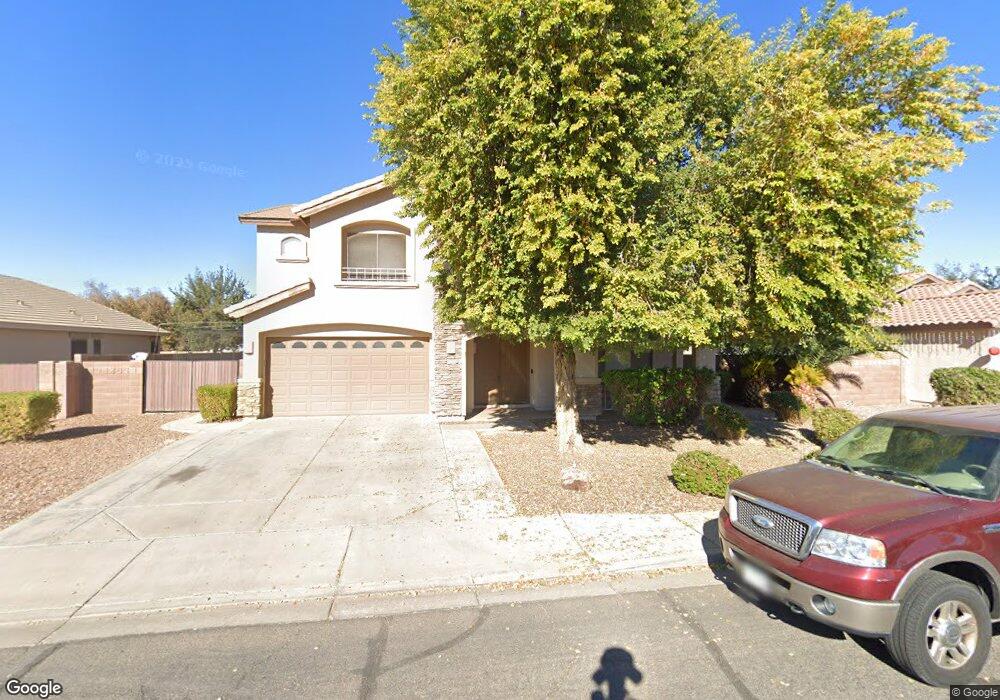
1750 E Lynx Place Chandler, AZ 85249
South Chandler NeighborhoodEstimated Value: $748,000 - $765,000
5
Beds
3
Baths
3,119
Sq Ft
$242/Sq Ft
Est. Value
About This Home
This home is located at 1750 E Lynx Place, Chandler, AZ 85249 and is currently estimated at $755,401, approximately $242 per square foot. 1750 E Lynx Place is a home located in Maricopa County with nearby schools including Santan Elementary School, Santan Junior High School, and BASIS Chandler.
Ownership History
Date
Name
Owned For
Owner Type
Purchase Details
Closed on
Aug 8, 2005
Sold by
Valencia Nelly J
Bought by
Beall Matt R and Beall Faith J
Current Estimated Value
Home Financials for this Owner
Home Financials are based on the most recent Mortgage that was taken out on this home.
Original Mortgage
$359,650
Outstanding Balance
$186,982
Interest Rate
5.5%
Mortgage Type
Purchase Money Mortgage
Estimated Equity
$568,419
Purchase Details
Closed on
Mar 19, 2004
Sold by
Varelas Rafael and Valencia Nelly J
Bought by
Valencia Nelly J
Purchase Details
Closed on
Dec 19, 2001
Sold by
Fulton Homes Sales Corp
Bought by
Varelas Rafael and Valencia Nelly J
Home Financials for this Owner
Home Financials are based on the most recent Mortgage that was taken out on this home.
Original Mortgage
$181,200
Interest Rate
6.51%
Create a Home Valuation Report for This Property
The Home Valuation Report is an in-depth analysis detailing your home's value as well as a comparison with similar homes in the area
Home Values in the Area
Average Home Value in this Area
Purchase History
| Date | Buyer | Sale Price | Title Company |
|---|---|---|---|
| Beall Matt R | $475,000 | -- | |
| Valencia Nelly J | -- | -- | |
| Varelas Rafael | -- | Security Title Agency | |
| Fulton Homes Sales Corp | -- | Security Title Agency |
Source: Public Records
Mortgage History
| Date | Status | Borrower | Loan Amount |
|---|---|---|---|
| Open | Beall Matt R | $359,650 | |
| Previous Owner | Varelas Rafael | $181,200 | |
| Closed | Varelas Rafael | $22,650 |
Source: Public Records
Tax History Compared to Growth
Tax History
| Year | Tax Paid | Tax Assessment Tax Assessment Total Assessment is a certain percentage of the fair market value that is determined by local assessors to be the total taxable value of land and additions on the property. | Land | Improvement |
|---|---|---|---|---|
| 2025 | $2,818 | $35,558 | -- | -- |
| 2024 | $2,723 | $33,865 | -- | -- |
| 2023 | $2,723 | $54,810 | $10,960 | $43,850 |
| 2022 | $2,629 | $40,230 | $8,040 | $32,190 |
| 2021 | $2,746 | $37,670 | $7,530 | $30,140 |
| 2020 | $2,732 | $35,120 | $7,020 | $28,100 |
| 2019 | $2,629 | $32,430 | $6,480 | $25,950 |
| 2018 | $2,543 | $30,360 | $6,070 | $24,290 |
| 2017 | $2,373 | $30,230 | $6,040 | $24,190 |
| 2016 | $2,275 | $29,970 | $5,990 | $23,980 |
| 2015 | $2,212 | $29,600 | $5,920 | $23,680 |
Source: Public Records
Map
Nearby Homes
- 1792 E Powell Way
- 1895 E Crescent Way
- 1873 E San Carlos Place
- 1568 E Canyon Way
- 224XX S Cooper Rd
- 4450 S Rio Dr
- 23724 S 126th St
- 4468 S Leoma Ln
- Williamette Plan at Hazelwood
- Romana Plan at Hazelwood
- Daviana Plan at Hazelwood
- Barcelona Plan at Hazelwood
- 1858 E Coconino Dr
- 1684 E Coconino Dr
- Ascent Plan at McKinley Glenn
- 2153 E Cherrywood Place
- Allure Plan at McKinley Glenn
- 2060 E Prescott Place
- 23811 S Cooper Rd
- 1464 E Tonto Dr
- 1730 E Lynx Place
- 1770 E Lynx Place
- 1790 E Lynx Place
- 1749 E Lynx Place
- 1769 E Lynx Place
- 23035 S Tower Ave
- 1729 E Lynx Place
- 1710 E Lynx Place
- 1789 E Lynx Place
- 1709 E Lynx Place
- 1809 E Lynx Place
- 1752 E Powell Way
- 1830 E Lynx Place
- 1772 E Powell Way
- 1670 E Lynx Place
- 4737 S Marion Place
- 1689 E Lynx Place
- 4711 S Tower Ave
- 1829 E Lynx Place
- 1850 E Lynx Place