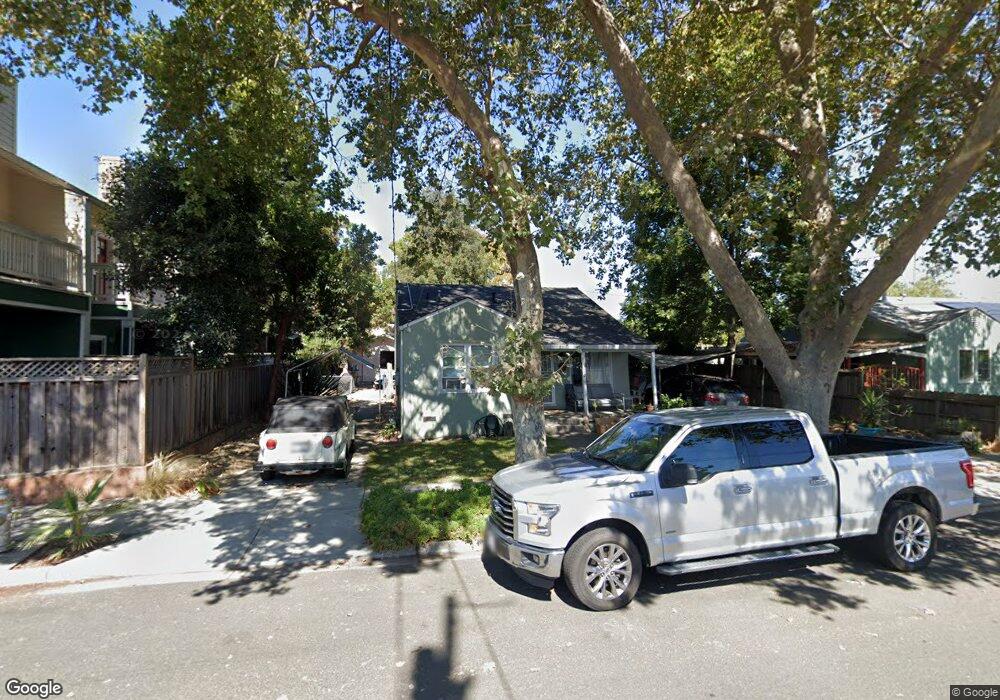
1750 H St Napa, CA 94559
Central Napa NeighborhoodEstimated Value: $747,111 - $805,000
2
Beds
1
Bath
986
Sq Ft
$785/Sq Ft
Est. Value
About This Home
This home is located at 1750 H St, Napa, CA 94559 and is currently estimated at $774,278, approximately $785 per square foot. 1750 H St is a home located in Napa County with nearby schools including Shearer Elementary School, Redwood Middle School, and Napa High School.
Ownership History
Date
Name
Owned For
Owner Type
Purchase Details
Closed on
Jan 4, 2017
Sold by
Chase John Matthew and Chase Kimberly Anne
Bought by
Chase John Matthew and Chase Kimberly Anne
Current Estimated Value
Home Financials for this Owner
Home Financials are based on the most recent Mortgage that was taken out on this home.
Original Mortgage
$353,000
Outstanding Balance
$289,858
Interest Rate
4.08%
Mortgage Type
New Conventional
Estimated Equity
$484,420
Purchase Details
Closed on
Sep 12, 2016
Sold by
Chase John Matthew
Bought by
Chase John Matthew and Harris Lynch Kimberly
Home Financials for this Owner
Home Financials are based on the most recent Mortgage that was taken out on this home.
Original Mortgage
$60,000
Interest Rate
3.45%
Mortgage Type
Stand Alone Second
Purchase Details
Closed on
Feb 26, 2013
Sold by
Federal National Mortgage Association
Bought by
Chase John M
Home Financials for this Owner
Home Financials are based on the most recent Mortgage that was taken out on this home.
Original Mortgage
$200,033
Interest Rate
3.34%
Mortgage Type
FHA
Purchase Details
Closed on
Sep 4, 2012
Sold by
Laymon Ray A and Laymon Michelle K
Bought by
Federal National Mortgage Association
Purchase Details
Closed on
Aug 27, 2007
Sold by
Harrell David G and Harrell Consuelo
Bought by
Laymon Ray A and Laymon Michelle K
Home Financials for this Owner
Home Financials are based on the most recent Mortgage that was taken out on this home.
Original Mortgage
$305,600
Interest Rate
6.74%
Mortgage Type
Purchase Money Mortgage
Purchase Details
Closed on
Jan 26, 2006
Sold by
Harrell David G
Bought by
Harrell David G and Harrell Consuelo
Home Financials for this Owner
Home Financials are based on the most recent Mortgage that was taken out on this home.
Original Mortgage
$322,000
Interest Rate
6.21%
Mortgage Type
New Conventional
Purchase Details
Closed on
May 24, 1999
Bought by
Harrell David G
Home Financials for this Owner
Home Financials are based on the most recent Mortgage that was taken out on this home.
Original Mortgage
$149,350
Interest Rate
6.86%
Mortgage Type
VA
Purchase Details
Closed on
Aug 22, 1997
Sold by
Simmons Daniel R and Simmons Juanita G
Bought by
Williamson Todd Joel and Williamson Mary Theresa
Home Financials for this Owner
Home Financials are based on the most recent Mortgage that was taken out on this home.
Original Mortgage
$120,650
Interest Rate
7.34%
Create a Home Valuation Report for This Property
The Home Valuation Report is an in-depth analysis detailing your home's value as well as a comparison with similar homes in the area
Home Values in the Area
Average Home Value in this Area
Purchase History
| Date | Buyer | Sale Price | Title Company |
|---|---|---|---|
| Chase John Matthew | -- | First American Title Company | |
| Chase John Matthew | $30,000 | Fidelity National Title Co | |
| Chase John M | $266,000 | Fidelity National Title Co | |
| Federal National Mortgage Association | $341,140 | Landsafe Title | |
| Laymon Ray A | $382,000 | Napa Land Title Company | |
| Harrell David G | -- | Fidelity National Title Co | |
| Harrell David G | $145,000 | Chicago Title Co | |
| Williamson Todd Joel | $127,000 | Napa Land Title Company |
Source: Public Records
Mortgage History
| Date | Status | Borrower | Loan Amount |
|---|---|---|---|
| Open | Chase John Matthew | $353,000 | |
| Closed | Chase John Matthew | $60,000 | |
| Closed | Chase John M | $200,033 | |
| Previous Owner | Laymon Ray A | $305,600 | |
| Previous Owner | Harrell David G | $322,000 | |
| Previous Owner | Harrell David G | $149,350 | |
| Previous Owner | Williamson Todd Joel | $120,650 |
Source: Public Records
Tax History Compared to Growth
Tax History
| Year | Tax Paid | Tax Assessment Tax Assessment Total Assessment is a certain percentage of the fair market value that is determined by local assessors to be the total taxable value of land and additions on the property. | Land | Improvement |
|---|---|---|---|---|
| 2025 | $4,774 | $372,809 | $184,707 | $188,102 |
| 2024 | $4,774 | $365,500 | $181,086 | $184,414 |
| 2023 | $4,774 | $358,335 | $177,536 | $180,799 |
| 2022 | $4,639 | $351,309 | $174,055 | $177,254 |
| 2021 | $4,577 | $344,422 | $170,643 | $173,779 |
| 2020 | $4,545 | $340,892 | $168,894 | $171,998 |
| 2019 | $4,444 | $334,209 | $165,583 | $168,626 |
| 2018 | $4,373 | $327,657 | $162,337 | $165,320 |
| 2017 | $4,273 | $321,233 | $159,154 | $162,079 |
| 2016 | $3,718 | $276,700 | $156,034 | $120,666 |
| 2015 | $3,463 | $272,545 | $153,691 | $118,854 |
| 2014 | $3,406 | $267,207 | $150,681 | $116,526 |
Source: Public Records
Map
Nearby Homes
- 2340 California Blvd Unit 5
- 2340 California Blvd Unit B
- 2340 California Blvd Unit A
- 2340 California Blvd Unit C
- 1740 H St
- 2360 California Blvd Unit B
- 2360 California Blvd Unit C
- 2360 California Blvd Unit A
- 1714 H St
- 2350 California Blvd Unit E
- 2350 California Blvd Unit F
- 2350 California Blvd Unit A
- 2350 California Blvd Unit C
- 2350 California Blvd Unit G
- 2350 California Blvd Unit H
- 2350 California Blvd Unit D
- 2350 California Blvd Unit B
- 1767 H St
- 1777 H St
- 1717 H St