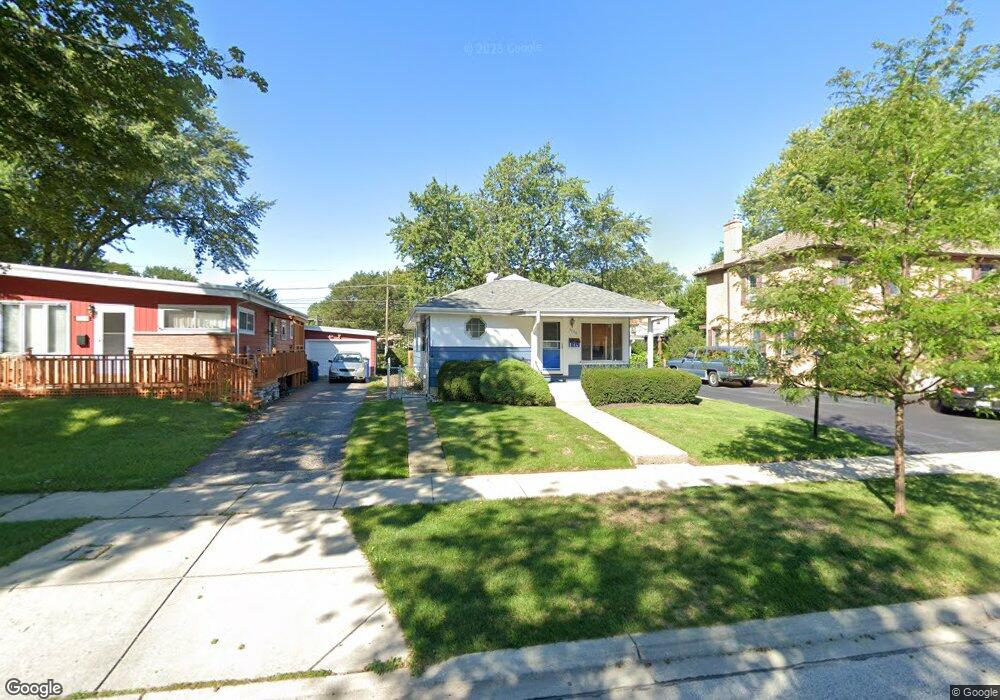
1750 Locust St Des Plaines, IL 60018
Estimated Value: $331,000 - $457,000
3
Beds
2
Baths
1,025
Sq Ft
$359/Sq Ft
Est. Value
About This Home
This home is located at 1750 Locust St, Des Plaines, IL 60018 and is currently estimated at $367,807, approximately $358 per square foot. 1750 Locust St is a home located in Cook County with nearby schools including South Elementary School, Algonquin Middle School, and Maine West High School.
Ownership History
Date
Name
Owned For
Owner Type
Purchase Details
Closed on
Mar 31, 2010
Sold by
Hawkins Joel H and Hawkins Martine M
Bought by
Hawkins Martine M and Hawkins Joel H
Current Estimated Value
Purchase Details
Closed on
Oct 17, 2009
Sold by
Hawkins Martine M and Hawkins Joel H
Bought by
Hawkins Joel H and Hawkins Martine M
Purchase Details
Closed on
Sep 14, 2007
Sold by
Hawkins Joel and Hawkins Martine M
Bought by
Hawkins Martine M and Hawkins Joel H
Purchase Details
Closed on
Dec 5, 1994
Sold by
Sullivan Timothy J and Sullivan Mary E
Bought by
Hawkins Joel and Hawkins Martine M
Home Financials for this Owner
Home Financials are based on the most recent Mortgage that was taken out on this home.
Original Mortgage
$148,500
Interest Rate
9.06%
Mortgage Type
Assumption
Create a Home Valuation Report for This Property
The Home Valuation Report is an in-depth analysis detailing your home's value as well as a comparison with similar homes in the area
Home Values in the Area
Average Home Value in this Area
Purchase History
| Date | Buyer | Sale Price | Title Company |
|---|---|---|---|
| Hawkins Martine M | -- | None Available | |
| Hawkins Joel H | -- | None Available | |
| Hawkins Martine M | -- | None Available | |
| Hawkins Joel | $158,500 | -- |
Source: Public Records
Mortgage History
| Date | Status | Borrower | Loan Amount |
|---|---|---|---|
| Closed | Hawkins Joel | $148,500 |
Source: Public Records
Tax History Compared to Growth
Tax History
| Year | Tax Paid | Tax Assessment Tax Assessment Total Assessment is a certain percentage of the fair market value that is determined by local assessors to be the total taxable value of land and additions on the property. | Land | Improvement |
|---|---|---|---|---|
| 2024 | $5,544 | $26,000 | $4,950 | $21,050 |
| 2023 | $5,370 | $26,000 | $4,950 | $21,050 |
| 2022 | $5,370 | $26,000 | $4,950 | $21,050 |
| 2021 | $4,089 | $17,466 | $4,125 | $13,341 |
| 2020 | $4,106 | $17,466 | $4,125 | $13,341 |
| 2019 | $4,128 | $19,625 | $4,125 | $15,500 |
| 2018 | $5,030 | $21,114 | $3,630 | $17,484 |
| 2017 | $4,963 | $21,114 | $3,630 | $17,484 |
| 2016 | $4,925 | $21,114 | $3,630 | $17,484 |
| 2015 | $4,490 | $17,475 | $3,135 | $14,340 |
| 2014 | $4,411 | $17,475 | $3,135 | $14,340 |
| 2013 | $4,965 | $19,836 | $3,135 | $16,701 |
Source: Public Records
Map
Nearby Homes
- 1928 Kennicott Ct
- 1640 S River Rd
- 1721 Linden St
- 1536 Orchard St
- 1724 Illinois St
- 1689 S Elm St
- 1700 E Forest Ave
- 1632 S Elm St
- 1278 E River Dr
- 2017 Pine St Unit B
- 1489 E Algonquin Rd
- 1783 Lee St
- 1706 Buckingham Dr
- 2015 Busse Hwy
- 1641 E Touhy Ave
- 1629 E Touhy Ave
- 960 S River Rd Unit 410
- 960 S River Rd Unit 208
- 38 E Touhy Ave
- 1241 Elliott St