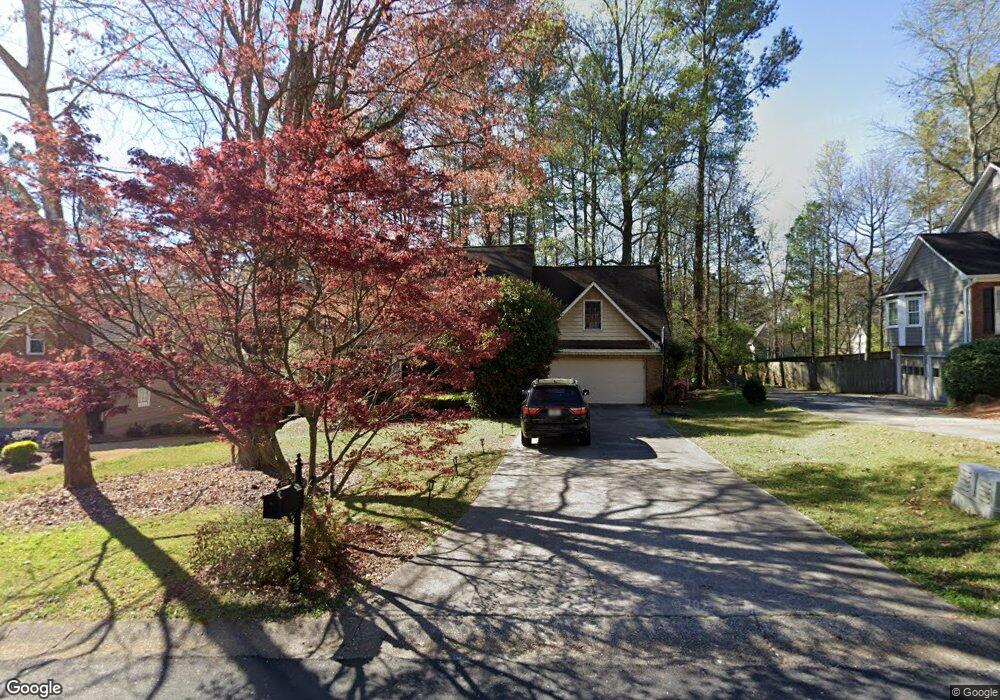
1750 Milford Crk Ovrlk SW Unit 5 Marietta, GA 30008
Southwestern Marietta NeighborhoodEstimated Value: $419,000 - $438,000
4
Beds
3
Baths
2,492
Sq Ft
$170/Sq Ft
Est. Value
About This Home
This home is located at 1750 Milford Crk Ovrlk SW Unit 5, Marietta, GA 30008 and is currently estimated at $424,370, approximately $170 per square foot. 1750 Milford Crk Ovrlk SW Unit 5 is a home located in Cobb County with nearby schools including Birney Elementary School, Smitha Middle School, and Osborne High School.
Ownership History
Date
Name
Owned For
Owner Type
Purchase Details
Closed on
May 2, 2016
Sold by
Ryan Miller
Bought by
Butler Brandon and Butler Lanetra
Current Estimated Value
Home Financials for this Owner
Home Financials are based on the most recent Mortgage that was taken out on this home.
Original Mortgage
$198,341
Outstanding Balance
$157,466
Interest Rate
3.66%
Estimated Equity
$266,904
Purchase Details
Closed on
Nov 30, 2006
Sold by
Jones Barbara J
Bought by
Shabazz Akbar S
Home Financials for this Owner
Home Financials are based on the most recent Mortgage that was taken out on this home.
Original Mortgage
$206,755
Interest Rate
6.36%
Mortgage Type
New Conventional
Create a Home Valuation Report for This Property
The Home Valuation Report is an in-depth analysis detailing your home's value as well as a comparison with similar homes in the area
Home Values in the Area
Average Home Value in this Area
Purchase History
| Date | Buyer | Sale Price | Title Company |
|---|---|---|---|
| Butler Brandon | -- | -- | |
| Shabazz Akbar S | $210,000 | -- |
Source: Public Records
Mortgage History
| Date | Status | Borrower | Loan Amount |
|---|---|---|---|
| Open | Butler Brandon | $198,341 | |
| Closed | Butler Brandon | -- | |
| Previous Owner | Shabazz Akbar S | $206,755 | |
| Previous Owner | Butler Brandon | $138,400 |
Source: Public Records
Tax History Compared to Growth
Tax History
| Year | Tax Paid | Tax Assessment Tax Assessment Total Assessment is a certain percentage of the fair market value that is determined by local assessors to be the total taxable value of land and additions on the property. | Land | Improvement |
|---|---|---|---|---|
| 2025 | $5,111 | $169,620 | $35,200 | $134,420 |
| 2024 | $5,114 | $169,620 | $35,200 | $134,420 |
| 2023 | $4,763 | $157,988 | $10,000 | $147,988 |
| 2022 | $4,127 | $135,976 | $10,000 | $125,976 |
| 2021 | $3,403 | $112,120 | $10,000 | $102,120 |
| 2020 | $3,122 | $102,868 | $10,000 | $92,868 |
| 2019 | $2,841 | $93,600 | $10,000 | $83,600 |
| 2018 | $2,841 | $93,600 | $10,000 | $83,600 |
| 2017 | $2,238 | $77,840 | $10,000 | $67,840 |
| 2016 | $2,238 | $77,840 | $10,000 | $67,840 |
| 2015 | $1,759 | $59,696 | $8,000 | $51,696 |
| 2014 | $1,774 | $59,696 | $0 | $0 |
Source: Public Records
Map
Nearby Homes
- 3055 Milford Chase Overlook SW
- 3123 Milford Chase SW
- 1719 Silverchase Dr SW
- 1618 Sparrow Wood Ln SW
- 1559 Woodmore Dr SW
- 1613 Sparrow Wood Ln SW Unit 3
- 3075 Milford Chase SW
- 3145 Fern Valley Dr SW
- 3340 Vineland Dr SW
- 1427 Lost Bridge Rd
- 3106 Sasanqua Ln SW
- 0 Burfordi Dr SW Unit 7658493
- 0 Burfordi Dr SW Unit 10637361
- 2700 Flintlock Ln SW
- 1697 Rustic Dr SW
- 1308 Willamette Way
- 2964 Edgemont Ln SW
- 3000 Fern Valley Dr SW
- 2099 Redbud Ct SW
- 1750 N Milford Creek Ln SW Unit 326
- 1750 N Milford Creek Ln SW
- 1810 Milford Creek Overlook SW
- 1760 Milford Creek Overlook SW
- 1780 Milford Creek Overlook SW
- 1730 N Milford Creek Ln SW Unit 6
- 1770 N Milford Creek Ln SW
- 1770 N Milford Creek Ln SW
- 1770 Milford Creek Overlook SW
- 1730 Milford Crk Ovrlk SW Unit 5
- 1741 Milford Crk Ovrlk SW Unit 5
- 1611 N Milford Creek Ln SW
- 1611 N Milford Creek Ln SW Unit 6
- 1731 Milford Creek Overlook SW
- 1731 Milford Creek Courts SW
- 1731 Milford Crk Ovrlk SW
- N Milford Creek Ln
- 1601 N Milford Creek Ln SW
- 1751 Milford Creek Overlook SW
- 1751 Milford Creek Overlook SW Unit 5