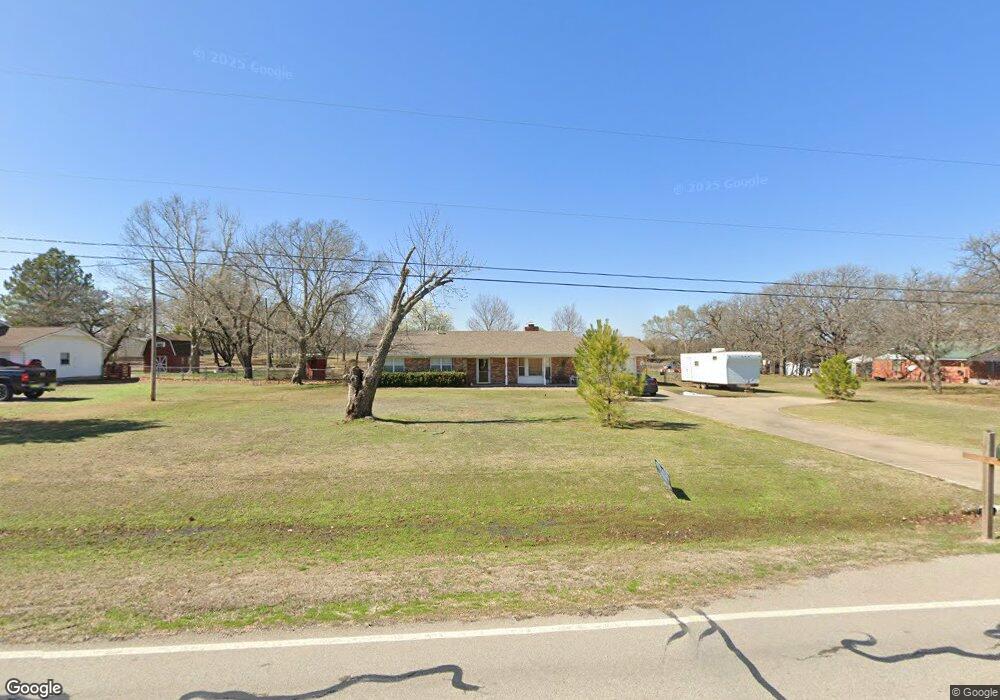
17502 S Rock Creek Rd Shawnee, OK 74801
Estimated Value: $226,818 - $300,000
3
Beds
2
Baths
1,692
Sq Ft
$159/Sq Ft
Est. Value
About This Home
This home is located at 17502 S Rock Creek Rd, Shawnee, OK 74801 and is currently estimated at $268,955, approximately $158 per square foot. 17502 S Rock Creek Rd is a home located in Pottawatomie County with nearby schools including South Rock Creek Public School.
Ownership History
Date
Name
Owned For
Owner Type
Purchase Details
Closed on
Oct 15, 2021
Sold by
Kersey Joseph D and Kersey Autumn
Bought by
Kersey Joseph D
Current Estimated Value
Purchase Details
Closed on
Aug 31, 2005
Sold by
Marble Tommy W and Marble April T
Bought by
Stout Royce G and Stout Martha A
Home Financials for this Owner
Home Financials are based on the most recent Mortgage that was taken out on this home.
Original Mortgage
$85,000
Outstanding Balance
$44,518
Interest Rate
5.81%
Mortgage Type
New Conventional
Estimated Equity
$224,437
Purchase Details
Closed on
May 19, 2004
Sold by
Robbins Randy and Robbins Ronda
Bought by
Marble Tommy and Marble April
Create a Home Valuation Report for This Property
The Home Valuation Report is an in-depth analysis detailing your home's value as well as a comparison with similar homes in the area
Home Values in the Area
Average Home Value in this Area
Purchase History
| Date | Buyer | Sale Price | Title Company |
|---|---|---|---|
| Kersey Joseph D | -- | None Available | |
| Stout Royce G | $112,000 | None Available | |
| Marble Tommy | $119,000 | -- |
Source: Public Records
Mortgage History
| Date | Status | Borrower | Loan Amount |
|---|---|---|---|
| Open | Stout Royce G | $85,000 |
Source: Public Records
Tax History Compared to Growth
Tax History
| Year | Tax Paid | Tax Assessment Tax Assessment Total Assessment is a certain percentage of the fair market value that is determined by local assessors to be the total taxable value of land and additions on the property. | Land | Improvement |
|---|---|---|---|---|
| 2025 | $1,210 | $16,835 | $694 | $16,141 |
| 2024 | $1,374 | $16,344 | $674 | $15,670 |
| 2023 | $1,374 | $15,869 | $504 | $15,365 |
| 2022 | $1,361 | $15,869 | $504 | $15,365 |
| 2021 | $1,173 | $15,869 | $504 | $15,365 |
| 2020 | $1,507 | $16,439 | $504 | $15,935 |
| 2019 | $1,536 | $16,725 | $504 | $16,221 |
| 2018 | $1,592 | $16,919 | $504 | $16,415 |
| 2017 | $1,598 | $17,068 | $504 | $16,564 |
| 2016 | $1,460 | $16,627 | $504 | $16,123 |
| 2015 | $1,452 | $16,143 | $504 | $15,639 |
| 2014 | $1,529 | $16,944 | $2,880 | $14,064 |
Source: Public Records
Map
Nearby Homes
- 17701 S Rock Creek Rd
- 45210 Hardesty Rd
- 45201 Hardesty Rd
- 00 S Rock Creek Rd
- 00 Hardesty Rd 15 Acres
- 44303 Hardesty Rd
- 16710 Kings Rd
- 18509 Brangus Rd
- 16504 Kings Rd
- 00 Allyson Ln
- 4 Hillcrest Dr
- 000 E Highland St
- 15809 S Rock Creek Rd
- 44630 Kingsbury
- 44508 Kingsbury Ln
- 00 Charleston Pointe
- 301 Clubhouse Dr
- 601 Pool Ln
- 1 Country Club Rd
- 607 Pool Place
- 17608 S Rock Creek Rd
- 17504 S Rock Creek Rd
- 17606 S Rock Creek Rd
- 17507 S Rock Creek Rd
- 6 Sunrock Dr
- 17508 S Rock Creek Rd
- 17604 S Rock Creek Rd
- 17503 S Rock Creek Rd
- 17406 S Rock Creek Rd
- 5 Sunrock Dr
- 17605 S Rock Creek Rd
- 17704 S Rock Creek Rd
- 4 Sunrock Dr
- 17409 S Rock Creek Rd
- 17703 S Rock Creek Rd
- 17465 S Rock Creek Rd
- 7 Sunrock Dr
- 17798 S Rock Creek Rd
- 3 Sunrock Dr
- 17393 S Rock Creek Rd