Estimated Value: $240,000 - $289,000
3
Beds
2
Baths
1,357
Sq Ft
$194/Sq Ft
Est. Value
About This Home
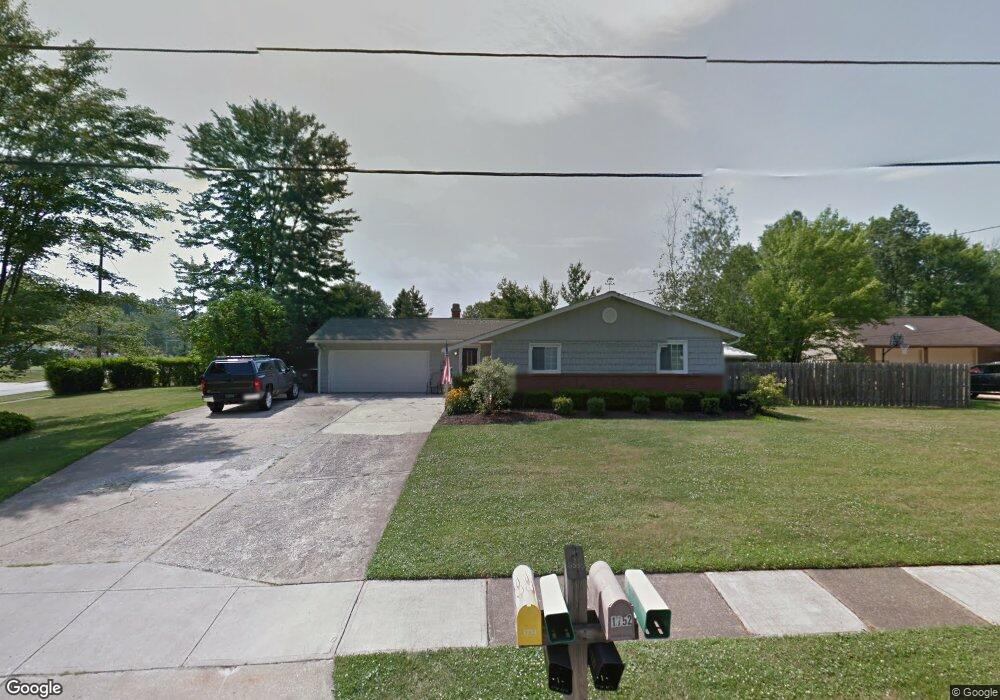
This home is located at 1751 Clearbrook Dr, Stow, OH 44224 and is currently estimated at $262,822, approximately $193 per square foot. 1751 Clearbrook Dr is a home located in Summit County with nearby schools including Stow-Munroe Falls High School, Primrose School of Hudson, and Holy Family Elementary School.
Ownership History
Date
Name
Owned For
Owner Type
Purchase Details
Closed on
May 29, 2014
Sold by
Jellison Bryan M and Jellison Cam Edana
Bought by
Cashin Mea L
Current Estimated Value
Home Financials for this Owner
Home Financials are based on the most recent Mortgage that was taken out on this home.
Original Mortgage
$152,000
Outstanding Balance
$115,962
Interest Rate
4.28%
Mortgage Type
VA
Estimated Equity
$146,860
Purchase Details
Closed on
Feb 19, 1997
Sold by
Est Ann Fleigh
Bought by
Jellison Bryan M
Home Financials for this Owner
Home Financials are based on the most recent Mortgage that was taken out on this home.
Original Mortgage
$96,900
Interest Rate
7.92%
Mortgage Type
New Conventional
Purchase Details
Closed on
Aug 16, 1995
Sold by
Brown Margaret A
Bought by
Fleigh Ann
Home Financials for this Owner
Home Financials are based on the most recent Mortgage that was taken out on this home.
Original Mortgage
$78,900
Interest Rate
7.64%
Mortgage Type
New Conventional
Create a Home Valuation Report for This Property
The Home Valuation Report is an in-depth analysis detailing your home's value as well as a comparison with similar homes in the area
Home Values in the Area
Average Home Value in this Area
Purchase History
| Date | Buyer | Sale Price | Title Company |
|---|---|---|---|
| Cashin Mea L | $152,000 | None Available | |
| Jellison Bryan M | $96,900 | -- | |
| Fleigh Ann | $99,900 | -- |
Source: Public Records
Mortgage History
| Date | Status | Borrower | Loan Amount |
|---|---|---|---|
| Open | Cashin Mea L | $152,000 | |
| Previous Owner | Jellison Bryan M | $96,900 | |
| Previous Owner | Fleigh Ann | $78,900 |
Source: Public Records
Tax History Compared to Growth
Tax History
| Year | Tax Paid | Tax Assessment Tax Assessment Total Assessment is a certain percentage of the fair market value that is determined by local assessors to be the total taxable value of land and additions on the property. | Land | Improvement |
|---|---|---|---|---|
| 2025 | $4,469 | $78,883 | $17,794 | $61,089 |
| 2024 | $4,469 | $78,883 | $17,794 | $61,089 |
| 2023 | $4,469 | $78,883 | $17,794 | $61,089 |
| 2022 | $3,732 | $58,002 | $13,083 | $44,919 |
| 2021 | $3,344 | $58,002 | $13,083 | $44,919 |
| 2020 | $3,287 | $58,000 | $13,080 | $44,920 |
| 2019 | $2,960 | $48,700 | $13,080 | $35,620 |
| 2018 | $2,912 | $48,700 | $13,080 | $35,620 |
| 2017 | $2,796 | $48,700 | $13,080 | $35,620 |
| 2016 | $2,861 | $45,410 | $13,080 | $32,330 |
| 2015 | $2,796 | $45,410 | $13,080 | $32,330 |
| 2014 | $2,876 | $45,410 | $13,080 | $32,330 |
| 2013 | $2,916 | $46,350 | $13,080 | $33,270 |
Source: Public Records
Map
Nearby Homes
- 1784 Clearbrook Dr
- 1808 Higby Dr Unit A
- 4877 Cedar Crest Ln
- 1664 Cypress Ct
- 4891 Cedar Crest Ln
- 1525 Spruce Hill Dr
- 4630 Red Willow Rd
- 0 Hibbard Dr
- 2279 Becket Cir
- 2188 Duxbury
- 5096 Andover Cir
- 4846 Garnet Cir
- 5112 Commanche Trail
- 1837 Norton Rd
- 4462 Timberdale Dr
- 5114 Bayside Lake Blvd
- 1620 Sapphire Dr
- 4424 Timberdale Dr Unit 4428
- 5131 Bayside Lake Blvd
- V/L Norton Rd
- 1783 Hibbard Dr
- 1763 Clearbrook Dr
- 4755 Cresswood Dr
- 1752 Clearbrook Dr
- 4765 Cresswood Dr
- 1769 Clearbrook Dr
- 1782 Hibbard Dr
- 1768 Clearbrook Dr
- 1796 Hibbard Dr
- 1819 Hibbard Dr
- 1806 Hibbard Dr
- 4725 Cresswood Dr
- 1773 Clearbrook Dr
- 1827 Hibbard Dr
- 4771 Cresswood Dr
- 4692 Trillium Dr
- 1759 Hibbard Dr
- 4756 Cresswood Dr
- 1779 Clearbrook Dr
- 1799 Higby Dr