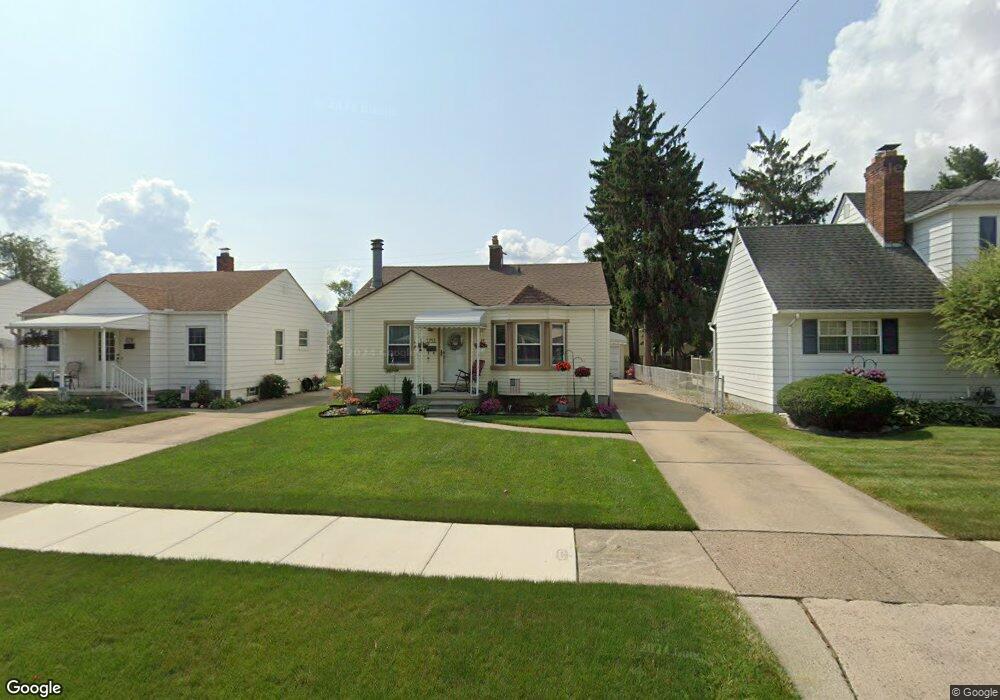
1751 Maple St Wyandotte, MI 48192
Estimated Value: $131,000 - $158,000
2
Beds
1
Bath
702
Sq Ft
$207/Sq Ft
Est. Value
About This Home
This home is located at 1751 Maple St, Wyandotte, MI 48192 and is currently estimated at $145,183, approximately $206 per square foot. 1751 Maple St is a home located in Wayne County with nearby schools including Washington Elementary School, Woodrow Wilson School, and Roosevelt High School.
Ownership History
Date
Name
Owned For
Owner Type
Purchase Details
Closed on
Oct 17, 2008
Sold by
Federal National Mortgage Association
Bought by
Scott Debra A
Current Estimated Value
Purchase Details
Closed on
Nov 19, 2007
Sold by
Mortgage Electronic Registration Systems
Bought by
Federal National Mortgage Association
Purchase Details
Closed on
Nov 14, 2007
Sold by
Quinn Yvonne M
Bought by
Mortgage Electronic Registration Systems
Purchase Details
Closed on
Mar 4, 2004
Sold by
Mckeethan Gayle A and Fricke Gayle A
Bought by
Quinn Yvonne M
Purchase Details
Closed on
Aug 27, 1997
Sold by
Kakoczki Susan A
Bought by
Gayle A Fricke
Create a Home Valuation Report for This Property
The Home Valuation Report is an in-depth analysis detailing your home's value as well as a comparison with similar homes in the area
Home Values in the Area
Average Home Value in this Area
Purchase History
| Date | Buyer | Sale Price | Title Company |
|---|---|---|---|
| Scott Debra A | $48,000 | Warranty Title Agency Llc | |
| Federal National Mortgage Association | -- | None Available | |
| Mortgage Electronic Registration Systems | $88,285 | None Available | |
| Quinn Yvonne M | $103,000 | Multiple | |
| Gayle A Fricke | $78,500 | -- |
Source: Public Records
Tax History Compared to Growth
Tax History
| Year | Tax Paid | Tax Assessment Tax Assessment Total Assessment is a certain percentage of the fair market value that is determined by local assessors to be the total taxable value of land and additions on the property. | Land | Improvement |
|---|---|---|---|---|
| 2025 | $1,354 | $62,200 | $0 | $0 |
| 2024 | $1,354 | $57,900 | $0 | $0 |
| 2023 | $1,292 | $52,400 | $0 | $0 |
| 2022 | $1,496 | $47,700 | $0 | $0 |
| 2021 | $1,489 | $44,900 | $0 | $0 |
| 2020 | $1,469 | $40,200 | $0 | $0 |
| 2019 | $1,451 | $38,000 | $0 | $0 |
| 2018 | $1,165 | $30,800 | $0 | $0 |
| 2017 | $499 | $30,800 | $0 | $0 |
| 2016 | $1,377 | $28,000 | $0 | $0 |
| 2015 | $2,457 | $26,000 | $0 | $0 |
| 2013 | $2,380 | $23,800 | $0 | $0 |
| 2012 | $1,129 | $24,500 | $7,300 | $17,200 |
Source: Public Records
Map
Nearby Homes