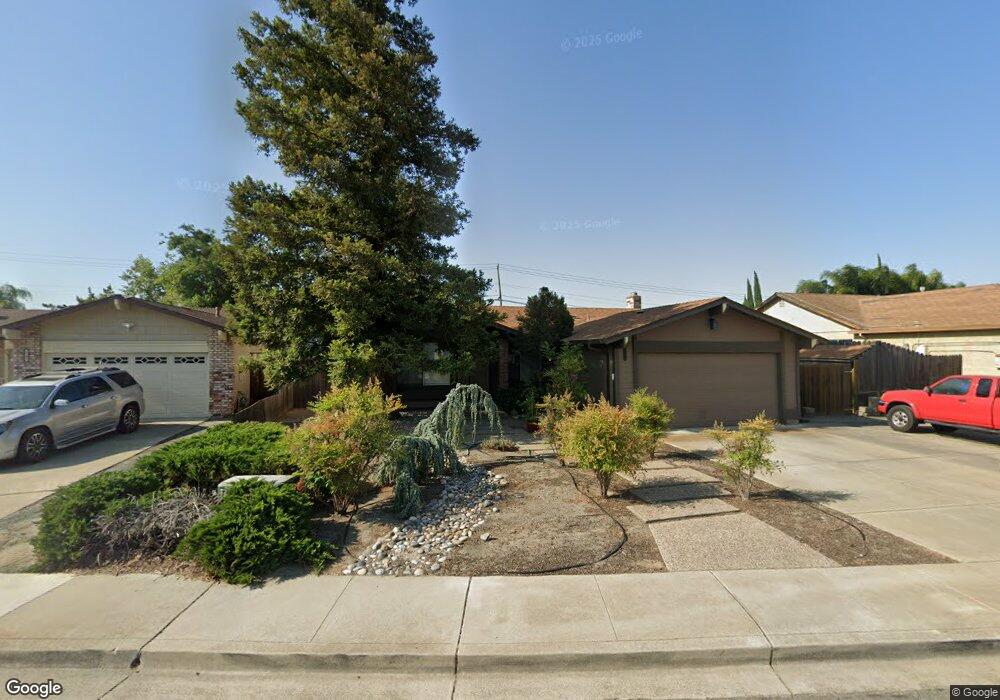
1751 Port Way Oakley, CA 94561
Estimated Value: $579,862 - $617,000
3
Beds
2
Baths
1,431
Sq Ft
$418/Sq Ft
Est. Value
About This Home
This home is located at 1751 Port Way, Oakley, CA 94561 and is currently estimated at $597,966, approximately $417 per square foot. 1751 Port Way is a home located in Contra Costa County with nearby schools including Oakley Elementary School, O'Hara Park Middle School, and Freedom High School.
Ownership History
Date
Name
Owned For
Owner Type
Purchase Details
Closed on
Mar 27, 2024
Sold by
Zamora Paul and Zamora Michelle
Bought by
Paul Edward Zamora And Michelle Nicole Zamora and Zamora
Current Estimated Value
Purchase Details
Closed on
Apr 10, 2011
Sold by
The Secretary Of Housing & Urban Develop
Bought by
Zamora Paul and Zamora Michelle
Purchase Details
Closed on
Jul 7, 2010
Sold by
Citimortgage Inc
Bought by
The Sectatry Of Housing & Urban Developm
Purchase Details
Closed on
Mar 15, 2002
Sold by
Im Chang C and Im Un U
Bought by
Mason Jody M and Mason Susan
Home Financials for this Owner
Home Financials are based on the most recent Mortgage that was taken out on this home.
Original Mortgage
$251,447
Interest Rate
6.84%
Mortgage Type
Purchase Money Mortgage
Create a Home Valuation Report for This Property
The Home Valuation Report is an in-depth analysis detailing your home's value as well as a comparison with similar homes in the area
Home Values in the Area
Average Home Value in this Area
Purchase History
| Date | Buyer | Sale Price | Title Company |
|---|---|---|---|
| Paul Edward Zamora And Michelle Nicole Zamora | -- | None Listed On Document | |
| Zamora Paul | $143,000 | Chicago Title Company | |
| The Sectatry Of Housing & Urban Developm | -- | Cr Title Services Inc | |
| Citimortgage Inc | $267,983 | Cr Title Services Inc | |
| Mason Jody M | $255,000 | First American Title Guarant |
Source: Public Records
Mortgage History
| Date | Status | Borrower | Loan Amount |
|---|---|---|---|
| Previous Owner | Mason Jody M | $251,447 |
Source: Public Records
Tax History Compared to Growth
Tax History
| Year | Tax Paid | Tax Assessment Tax Assessment Total Assessment is a certain percentage of the fair market value that is determined by local assessors to be the total taxable value of land and additions on the property. | Land | Improvement |
|---|---|---|---|---|
| 2025 | $3,005 | $183,193 | $44,833 | $138,360 |
| 2024 | $2,978 | $179,602 | $43,954 | $135,648 |
| 2023 | $2,978 | $176,082 | $43,093 | $132,989 |
| 2022 | $2,959 | $172,631 | $42,249 | $130,382 |
| 2021 | $2,896 | $169,247 | $41,421 | $127,826 |
| 2019 | $2,659 | $164,230 | $40,194 | $124,036 |
| 2018 | $2,602 | $161,010 | $39,406 | $121,604 |
| 2017 | $2,583 | $157,854 | $38,634 | $119,220 |
| 2016 | $2,462 | $154,760 | $37,877 | $116,883 |
| 2015 | $2,475 | $152,437 | $37,309 | $115,128 |
| 2014 | $2,441 | $149,452 | $36,579 | $112,873 |
Source: Public Records
Map
Nearby Homes
- 4334 Redwood Dr
- 1450 Gamay Cir
- 1916 Gamay Dr
- 151 Bedford Ln
- 2019 Verona Ct
- 2118 Connie Ln
- 80 Mandeville Ct
- 0 Empire Ave Unit 41111855
- 0 Empire Ave Unit 41097524
- 1541 Larkspur Ct
- 4670 Fuschia Way
- 5025 Martin St
- 2085 Springbrook Ct
- 1877 Babbe St
- 2084 Springbrook Ct
- 1927 Babbe St
- 881 Chianti Way
- 2107 Chicory Dr
- 1859 Santa fe St
- 4901 Beldin Ln
- 1761 Port Way
- 1741 Port Way
- 1731 Port Way
- 1760 W Cypress Rd
- 1773 Port Way
- 1740 Port Way
- 1772 W Cypress Rd
- 1750 Port Way
- 1721 Port Way
- 4602 Wente Ct
- 1730 Port Way
- 1785 Port Way
- 1784 W Cypress Rd
- 1711 Port Way
- 1720 Port Way
- 4618 Wente Ct
- 4570 Teakwood Ct
- 4581 Teakwood Ct
- 1797 Port Way
- 1764 Ponderosa Dr