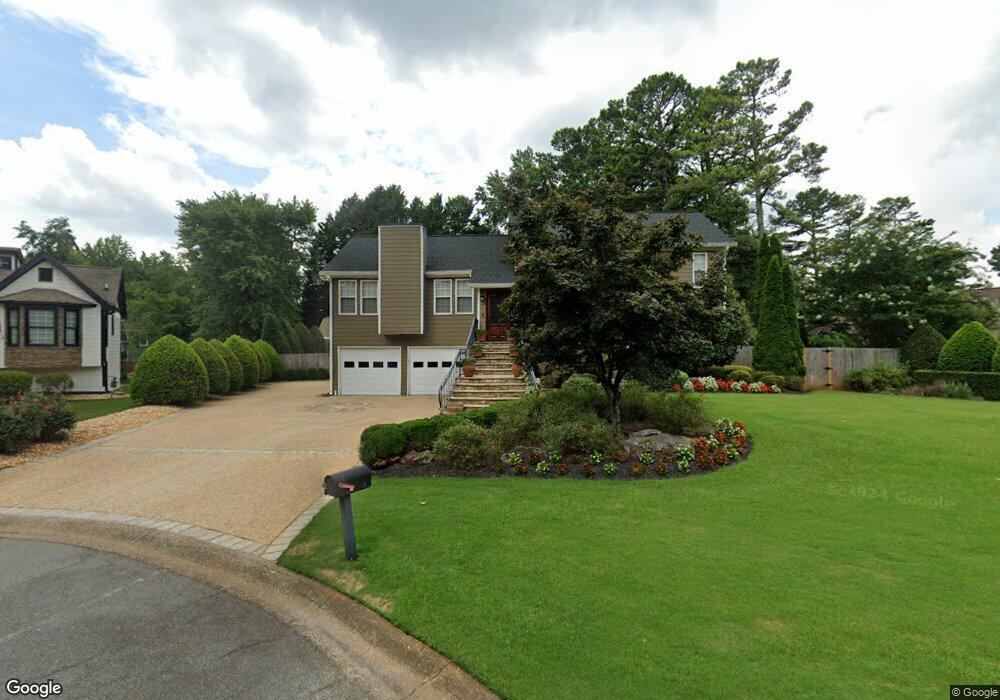
1752 Arrowhead Ct Marietta, GA 30062
Eastern Marietta NeighborhoodEstimated Value: $415,000 - $493,000
4
Beds
3
Baths
1,826
Sq Ft
$252/Sq Ft
Est. Value
About This Home
This home is located at 1752 Arrowhead Ct, Marietta, GA 30062 and is currently estimated at $460,330, approximately $252 per square foot. 1752 Arrowhead Ct is a home located in Cobb County with nearby schools including Kincaid Elementary School, Simpson Middle School, and Sprayberry High School.
Ownership History
Date
Name
Owned For
Owner Type
Purchase Details
Closed on
Feb 11, 2011
Sold by
Vazquez Jaime
Bought by
Vazquez Jaime and Sanchez-Cervantes Maria
Current Estimated Value
Home Financials for this Owner
Home Financials are based on the most recent Mortgage that was taken out on this home.
Original Mortgage
$151,500
Outstanding Balance
$4,655
Interest Rate
4.71%
Mortgage Type
New Conventional
Estimated Equity
$455,675
Purchase Details
Closed on
Dec 29, 2000
Sold by
Varner Richard H and Varner Susan M
Bought by
Vazquez Jaime
Home Financials for this Owner
Home Financials are based on the most recent Mortgage that was taken out on this home.
Original Mortgage
$100,000
Interest Rate
7.75%
Mortgage Type
New Conventional
Purchase Details
Closed on
Sep 3, 1998
Sold by
Varner Richard N and Varner Susan M
Bought by
Varner Richard N
Home Financials for this Owner
Home Financials are based on the most recent Mortgage that was taken out on this home.
Original Mortgage
$97,000
Interest Rate
6.95%
Mortgage Type
New Conventional
Create a Home Valuation Report for This Property
The Home Valuation Report is an in-depth analysis detailing your home's value as well as a comparison with similar homes in the area
Home Values in the Area
Average Home Value in this Area
Purchase History
| Date | Buyer | Sale Price | Title Company |
|---|---|---|---|
| Vazquez Jaime | -- | -- | |
| Vazquez Jaime | $165,000 | -- | |
| Varner Richard N | -- | -- |
Source: Public Records
Mortgage History
| Date | Status | Borrower | Loan Amount |
|---|---|---|---|
| Open | Vazquez Jaime | $151,500 | |
| Previous Owner | Vazquez Jaime | $100,000 | |
| Previous Owner | Varner Richard N | $97,000 |
Source: Public Records
Tax History Compared to Growth
Tax History
| Year | Tax Paid | Tax Assessment Tax Assessment Total Assessment is a certain percentage of the fair market value that is determined by local assessors to be the total taxable value of land and additions on the property. | Land | Improvement |
|---|---|---|---|---|
| 2025 | $4,931 | $191,004 | $38,000 | $153,004 |
| 2024 | $4,520 | $171,884 | $30,000 | $141,884 |
| 2023 | $3,977 | $171,884 | $30,000 | $141,884 |
| 2022 | $4,552 | $171,884 | $30,000 | $141,884 |
| 2021 | $3,992 | $146,312 | $24,000 | $122,312 |
| 2020 | $3,540 | $125,660 | $22,000 | $103,660 |
| 2019 | $3,814 | $125,660 | $22,000 | $103,660 |
| 2018 | $3,461 | $114,036 | $19,200 | $94,836 |
| 2017 | $2,854 | $99,256 | $19,200 | $80,056 |
| 2016 | $2,718 | $94,552 | $11,200 | $83,352 |
| 2015 | $2,786 | $94,552 | $11,200 | $83,352 |
| 2014 | $2,203 | $74,152 | $0 | $0 |
Source: Public Records
Map
Nearby Homes
- 2116 Morgan Rd NE
- 1780 Kinridge Rd
- 2314 Sandy Oaks Dr
- 2020 Starlight Dr
- 1822 Hasty Rd
- 1972 Granite Mill Rd
- 1505 Kincaid Rd
- 2252 Carefree Cir Unit 3
- 1854 Butterfly Way
- Robie Plan at The Village at Sandy Plains
- Harbor Plan at The Village at Sandy Plains
- Hanover Plan at The Village at Sandy Plains
- Bowen Plan at The Village at Sandy Plains
- Elston Plan at The Village at Sandy Plains
- BALDWIN Plan at The Village at Sandy Plains
- 1850 Butterfly Way NE
- 1991 Kinridge Rd
- 1838 Butterfly NE
- 1900 Branch View Dr
- 1754 Arrowhead Ct
- 2072 Arrowhead Trail
- 2074 Arrowhead Trail
- 2068 Arrowhead Trail
- 1795 Trophy Dr
- 2070 Arrowhead Trail
- 1753 Arrowhead Ct
- 2066 Arrowhead Trail
- 1756 Arrowhead Ct
- 1797 Trophy Dr
- 1751 Arrowhead Ct
- 1755 Arrowhead Ct
- 1799 Trophy Dr
- 2078 Arrowhead Trail
- 2077 Arrowhead Trail
- 2075 Arrowhead Trail
- 2067 Arrowhead Trail
- 2079 Arrowhead Trail
- 1801 Trophy Dr
- 2065 Arrowhead Trail