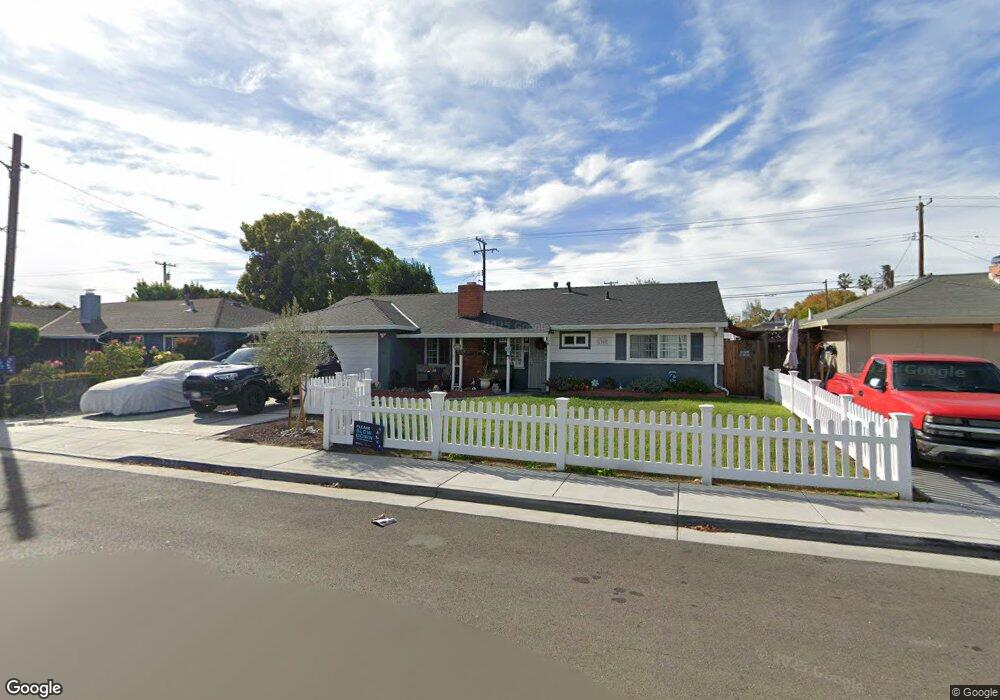
1752 Graham Ln Santa Clara, CA 95050
Estimated Value: $1,894,000 - $2,216,000
3
Beds
2
Baths
1,021
Sq Ft
$2,023/Sq Ft
Est. Value
About This Home
This home is located at 1752 Graham Ln, Santa Clara, CA 95050 and is currently estimated at $2,065,291, approximately $2,022 per square foot. 1752 Graham Ln is a home located in Santa Clara County with nearby schools including Scott Lane Elementary School, Buchser Middle School, and Santa Clara High School.
Ownership History
Date
Name
Owned For
Owner Type
Purchase Details
Closed on
Jan 6, 2012
Sold by
Lara Julieen L
Bought by
Lara Julieen
Current Estimated Value
Purchase Details
Closed on
Oct 14, 2008
Sold by
Lara Julieen
Bought by
Lara Julieen and Ordonez Roy M
Purchase Details
Closed on
May 3, 2001
Sold by
Ordonez Emig M
Bought by
Lara Julieen L
Purchase Details
Closed on
Jul 29, 1998
Sold by
Linda Harris
Bought by
Ordonez Roy M and Lara Julieen L
Home Financials for this Owner
Home Financials are based on the most recent Mortgage that was taken out on this home.
Original Mortgage
$187,000
Interest Rate
6.9%
Purchase Details
Closed on
Jul 28, 1998
Sold by
Ordonez Esther L
Bought by
Ordonez Roy M
Home Financials for this Owner
Home Financials are based on the most recent Mortgage that was taken out on this home.
Original Mortgage
$187,000
Interest Rate
6.9%
Purchase Details
Closed on
Sep 12, 1994
Sold by
Lopez Margarita
Bought by
Harris Linda
Create a Home Valuation Report for This Property
The Home Valuation Report is an in-depth analysis detailing your home's value as well as a comparison with similar homes in the area
Home Values in the Area
Average Home Value in this Area
Purchase History
| Date | Buyer | Sale Price | Title Company |
|---|---|---|---|
| Lara Julieen | -- | None Available | |
| Lara Julieen | -- | None Available | |
| Lara Julieen L | -- | -- | |
| Ordonez Roy M | $307,000 | Old Republic Title Company | |
| Ordonez Roy M | -- | Old Republic Title Company | |
| Harris Linda | -- | -- |
Source: Public Records
Mortgage History
| Date | Status | Borrower | Loan Amount |
|---|---|---|---|
| Previous Owner | Ordonez Roy M | $187,000 |
Source: Public Records
Tax History Compared to Growth
Tax History
| Year | Tax Paid | Tax Assessment Tax Assessment Total Assessment is a certain percentage of the fair market value that is determined by local assessors to be the total taxable value of land and additions on the property. | Land | Improvement |
|---|---|---|---|---|
| 2025 | $8,832 | $770,099 | $631,439 | $138,660 |
| 2024 | $8,832 | $755,000 | $619,058 | $135,942 |
| 2023 | $8,741 | $740,197 | $606,920 | $133,277 |
| 2022 | $8,594 | $725,684 | $595,020 | $130,664 |
| 2021 | $8,559 | $711,455 | $583,353 | $128,102 |
| 2020 | $8,403 | $704,161 | $577,372 | $126,789 |
| 2019 | $8,391 | $690,354 | $566,051 | $124,303 |
| 2018 | $7,851 | $676,818 | $554,952 | $121,866 |
| 2017 | $7,811 | $663,548 | $544,071 | $119,477 |
| 2016 | $7,657 | $650,538 | $533,403 | $117,135 |
| 2015 | $7,626 | $640,767 | $525,391 | $115,376 |
| 2014 | $7,244 | $628,216 | $515,100 | $113,116 |
Source: Public Records
Map
Nearby Homes
- 1628 Cunningham St
- 2331 Castro Place
- 2028 Staats Way
- 2272 Cabrillo Ave
- 2150 Menzel Place
- 1238 Las Palmas Dr
- 1400 Bowe Ave Unit 801
- 2171 Rancho Mccormick Blvd
- 1174 Carolyn Dr
- 2105 Rancho Mccormick Blvd
- 1938 Hillebrant Place
- 1855 Palm View Place Unit 123
- 2250 Monroe St Unit 201
- 2250 Monroe St Unit 238
- 1700 Civic Center Dr Unit 616
- 1700 Civic Center Dr Unit 707
- 1700 Civic Center Dr Unit 214
- 1700 Civic Center Dr Unit 404
- 1690 Civic Center Dr Unit 402
- 2785 Ball Place Unit 4
- 1744 Graham Ln
- 1764 Graham Ln
- 1732 Graham Ln
- 2382 Warburton Ave
- 1759 Graham Ln
- 1779 Graham Ln
- 1739 Graham Ln
- 2371 Fatjo Place
- 2374 Fatjo Place
- 2370 Warburton Ave
- 1719 Graham Ln
- 1773 Laine Ave
- 1769 Laine Ave
- 1820 Graham Ln
- 2387 Warburton Ave
- 1779 Laine Ave
- 1712 Graham Ln
- 2365 Fatjo Place
- 1763 Laine Ave
- 1783 Laine Ave