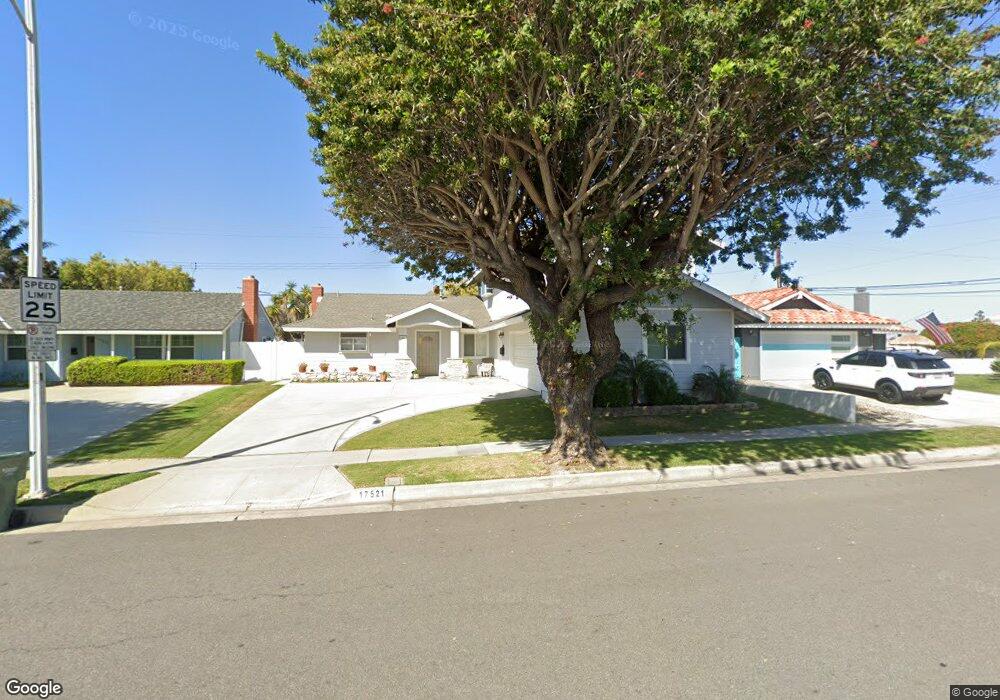
17521 Misty Ln Huntington Beach, CA 92649
Estimated Value: $1,545,000 - $1,936,000
5
Beds
4
Baths
2,405
Sq Ft
$731/Sq Ft
Est. Value
About This Home
This home is located at 17521 Misty Ln, Huntington Beach, CA 92649 and is currently estimated at $1,758,933, approximately $731 per square foot. 17521 Misty Ln is a home located in Orange County with nearby schools including Hope View Elementary School, Marine View Middle, and Huntington Beach High School.
Ownership History
Date
Name
Owned For
Owner Type
Purchase Details
Closed on
Mar 1, 2021
Sold by
Cormack Jody and Jody Cormack Living Trust
Bought by
Cormack Jody and The Jody Cormack Living Trust
Current Estimated Value
Home Financials for this Owner
Home Financials are based on the most recent Mortgage that was taken out on this home.
Original Mortgage
$200,592
Interest Rate
2.7%
Mortgage Type
New Conventional
Purchase Details
Closed on
May 9, 2016
Sold by
Cormack Jody C
Bought by
Cormack Jody and Jody Cormack Living Trust
Purchase Details
Closed on
Jun 5, 2014
Sold by
Cormack Gerald William and Cormack Kathleen Martha
Bought by
Cormack Jody C
Home Financials for this Owner
Home Financials are based on the most recent Mortgage that was taken out on this home.
Original Mortgage
$257,000
Interest Rate
4.17%
Mortgage Type
New Conventional
Purchase Details
Closed on
Nov 4, 2012
Sold by
Cormack Gerald William and Cormack Kathleen Martha
Bought by
Cormack Gerald William and Cormack Kathleen Martha
Create a Home Valuation Report for This Property
The Home Valuation Report is an in-depth analysis detailing your home's value as well as a comparison with similar homes in the area
Home Values in the Area
Average Home Value in this Area
Purchase History
| Date | Buyer | Sale Price | Title Company |
|---|---|---|---|
| Cormack Jody | -- | Ticor Title Company | |
| Cormack Jody | -- | None Available | |
| Cormack Jody C | -- | Provident Title Company | |
| Cormack Gerald William | -- | Provident Title Company |
Source: Public Records
Mortgage History
| Date | Status | Borrower | Loan Amount |
|---|---|---|---|
| Closed | Cormack Jody | $200,592 | |
| Closed | Cormack Jody C | $257,000 |
Source: Public Records
Tax History Compared to Growth
Tax History
| Year | Tax Paid | Tax Assessment Tax Assessment Total Assessment is a certain percentage of the fair market value that is determined by local assessors to be the total taxable value of land and additions on the property. | Land | Improvement |
|---|---|---|---|---|
| 2025 | $2,985 | $241,480 | $33,144 | $208,336 |
| 2024 | $2,985 | $236,746 | $32,495 | $204,251 |
| 2023 | $2,914 | $232,104 | $31,857 | $200,247 |
| 2022 | $2,868 | $227,553 | $31,232 | $196,321 |
| 2021 | $2,817 | $223,092 | $30,620 | $192,472 |
| 2020 | $2,786 | $220,805 | $30,306 | $190,499 |
| 2019 | $2,742 | $216,476 | $29,712 | $186,764 |
| 2018 | $2,683 | $212,232 | $29,130 | $183,102 |
| 2017 | $2,641 | $208,071 | $28,559 | $179,512 |
| 2016 | $2,539 | $203,992 | $27,999 | $175,993 |
| 2015 | $2,500 | $200,928 | $27,578 | $173,350 |
| 2014 | $2,279 | $181,024 | $27,038 | $153,986 |
Source: Public Records
Map
Nearby Homes
- 17532 Montbury Cir
- 17372 Forbes Ln
- 5812 Raphael Dr
- 5862 Raphael Dr
- 17352 Eucalyptus Ln
- 17982 Whitford Ln
- 17042 Twain Ln
- 6051 Summerdale Dr
- 5852 Bellfield Ln
- 17071 Pinehurst Ln
- 17231 Lido Ln
- 5262 Glenroy Dr
- 6012 Jasonwood Dr
- 5241 Glenroy Dr
- 17202 Corbina Ln Unit 108
- 18202 Foss Ln
- 17191 Corbina Ln Unit 110
- 6301 Warner Ave Unit 40
- 6301 Warner Ave Unit 88
- 6161 Norbrook Dr
- 17531 Misty Ln
- 17501 Misty Ln
- 17522 Montbury Cir
- 17502 Montbury Cir
- 17541 Misty Ln
- 5771 Price Dr
- 17542 Montbury Cir
- 17551 Misty Ln
- 17532 Misty Ln
- 17552 Montbury Cir
- 5781 Price Dr
- 17552 Misty Ln
- 17571 Misty Ln
- 17531 Montbury Cir
- 17521 Montbury Cir
- 17572 Montbury Cir
- 5762 Nordina Dr
- 17531 De Long Cir
- 5791 Price Dr
- 17541 Montbury Cir