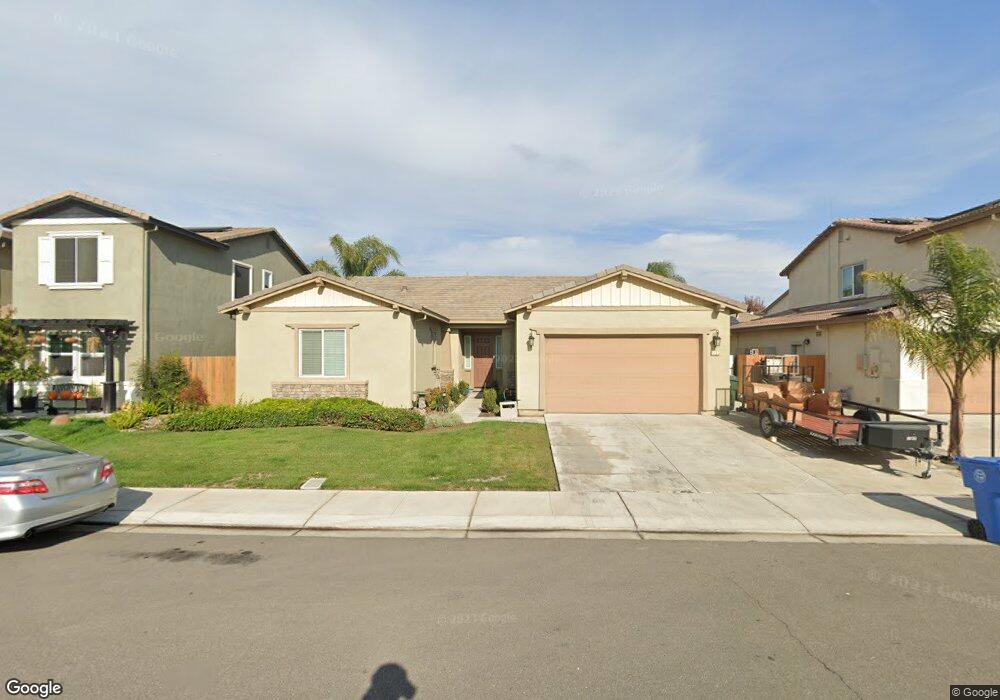
1753 Gary Owens St Manteca, CA 95337
Estimated Value: $557,000 - $684,000
3
Beds
3
Baths
2,085
Sq Ft
$308/Sq Ft
Est. Value
About This Home
This home is located at 1753 Gary Owens St, Manteca, CA 95337 and is currently estimated at $642,649, approximately $308 per square foot. 1753 Gary Owens St is a home located in San Joaquin County with nearby schools including Nile Garden Elementary School and Sierra High School.
Ownership History
Date
Name
Owned For
Owner Type
Purchase Details
Closed on
Jan 12, 2021
Sold by
Allen Regina L
Bought by
Allen Regina L
Current Estimated Value
Home Financials for this Owner
Home Financials are based on the most recent Mortgage that was taken out on this home.
Original Mortgage
$342,000
Outstanding Balance
$304,913
Interest Rate
2.65%
Mortgage Type
New Conventional
Estimated Equity
$337,736
Purchase Details
Closed on
Feb 20, 2015
Sold by
Dr Horton Bay Inc
Bought by
Allen Regina L
Home Financials for this Owner
Home Financials are based on the most recent Mortgage that was taken out on this home.
Original Mortgage
$301,491
Interest Rate
3.54%
Mortgage Type
New Conventional
Purchase Details
Closed on
Feb 18, 2015
Sold by
Allen Paul E
Bought by
Allen Regina L
Home Financials for this Owner
Home Financials are based on the most recent Mortgage that was taken out on this home.
Original Mortgage
$301,491
Interest Rate
3.54%
Mortgage Type
New Conventional
Create a Home Valuation Report for This Property
The Home Valuation Report is an in-depth analysis detailing your home's value as well as a comparison with similar homes in the area
Home Values in the Area
Average Home Value in this Area
Purchase History
| Date | Buyer | Sale Price | Title Company |
|---|---|---|---|
| Allen Regina L | -- | American Coast Title | |
| Allen Regina L | $335,000 | First American Title | |
| Allen Regina L | -- | First American Title Company |
Source: Public Records
Mortgage History
| Date | Status | Borrower | Loan Amount |
|---|---|---|---|
| Open | Allen Regina L | $342,000 | |
| Closed | Allen Regina L | $301,491 |
Source: Public Records
Tax History Compared to Growth
Tax History
| Year | Tax Paid | Tax Assessment Tax Assessment Total Assessment is a certain percentage of the fair market value that is determined by local assessors to be the total taxable value of land and additions on the property. | Land | Improvement |
|---|---|---|---|---|
| 2025 | $5,017 | $430,484 | $140,906 | $289,578 |
| 2024 | $4,886 | $422,044 | $138,144 | $283,900 |
| 2023 | $4,767 | $413,770 | $135,436 | $278,334 |
| 2022 | $4,671 | $405,658 | $132,781 | $272,877 |
| 2021 | $4,609 | $397,705 | $130,178 | $267,527 |
| 2020 | $4,432 | $393,628 | $128,844 | $264,784 |
| 2019 | $4,367 | $385,911 | $126,318 | $259,593 |
| 2018 | $4,052 | $353,836 | $123,842 | $229,994 |
| 2017 | $3,989 | $346,899 | $121,414 | $225,485 |
| 2016 | $3,890 | $340,099 | $119,034 | $221,065 |
| 2014 | $538 | $34,280 | $34,280 | $0 |
Source: Public Records
Map
Nearby Homes
- 1770 Ettle St
- 1747 Gladwall Ave
- 1957 W Woodward Ave
- 1602 Oleander Ave
- 1630 Red Ribbons Ln
- 1877 Lateral Ave
- 1565 Blue Lupine Ln
- 2178 Al Fonseca Ln
- 1232 Nabih Hamdan Ct
- 1204 Nabih Hamdan Ct
- Residence 1 Plan at Heston at Machado Ranch - Heston
- Residence 3 Plan at Heston at Machado Ranch - Heston
- Residence 1 Plan at Machado Ranch - Eastwood
- Residence 4 Plan at Machado Ranch - Eastwood
- Residence 2 Plan at Machado Ranch - Eastwood
- Residence 3 Plan at Machado Ranch - Eastwood
- Residence 2 Plan at Heston at Machado Ranch - Heston
- Residence 4 Plan at Heston at Machado Ranch - Heston
- 20109 S Union Rd
- 1635 Langum Way
- 1759 Gary Owens St
- 1761 Gary Owens St
- 1745 Gary Owens St
- 1752 Ettle St
- 1758 Ettle St
- 1767 Gary Owens St
- 1744 Ettle St
- 1739 Gary Owens St
- 1766 Ettle St
- 1750 Gary Owens St
- 1766 Ettles St
- 1771 Gary Owens St
- 1738 Ettle St
- 1742 Gary Owens St
- 1762 Gary Owens St
- 1731 Gary Owens St
- 1768 Gary Owens St
- 1730 Ettle St
- 1911 Salmon Ln
- 1779 Gary Owens St