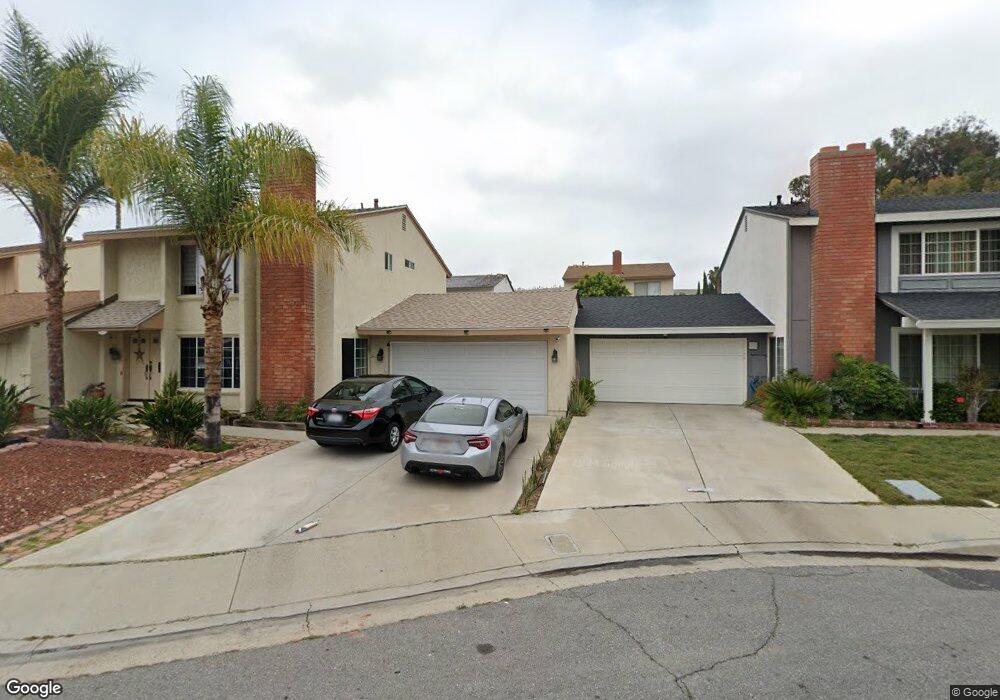
1753 Glenridge Cir West Covina, CA 91792
Woodside NeighborhoodEstimated Value: $738,182 - $788,000
3
Beds
3
Baths
1,440
Sq Ft
$529/Sq Ft
Est. Value
About This Home
This home is located at 1753 Glenridge Cir, West Covina, CA 91792 and is currently estimated at $761,046, approximately $528 per square foot. 1753 Glenridge Cir is a home located in Los Angeles County with nearby schools including Yorbita Elementary School, Giano Intermediate School, and Nogales High School.
Ownership History
Date
Name
Owned For
Owner Type
Purchase Details
Closed on
Dec 27, 2017
Sold by
Guzman Nick J De and Guzman Yolanda M De
Bought by
Guzman Nick J De and Guzman Yolanda M De
Current Estimated Value
Home Financials for this Owner
Home Financials are based on the most recent Mortgage that was taken out on this home.
Original Mortgage
$355,000
Outstanding Balance
$299,271
Interest Rate
3.9%
Mortgage Type
New Conventional
Estimated Equity
$461,775
Purchase Details
Closed on
Jan 26, 2000
Sold by
Deguzman Albert J and Deguzman Yolanda M
Bought by
Deguzman Nick J and Deguzman Yolanda M
Home Financials for this Owner
Home Financials are based on the most recent Mortgage that was taken out on this home.
Original Mortgage
$145,195
Interest Rate
8.26%
Mortgage Type
FHA
Purchase Details
Closed on
Oct 2, 1995
Sold by
Abesamis Ricardo S and Abesamis Elma M
Bought by
Deguzman Albert J and Deguzman Yolanda M
Create a Home Valuation Report for This Property
The Home Valuation Report is an in-depth analysis detailing your home's value as well as a comparison with similar homes in the area
Home Values in the Area
Average Home Value in this Area
Purchase History
| Date | Buyer | Sale Price | Title Company |
|---|---|---|---|
| Guzman Nick J De | -- | Pacific Coast Title Company | |
| Deguzman Nick J | -- | United Title | |
| Deguzman Albert J | -- | -- |
Source: Public Records
Mortgage History
| Date | Status | Borrower | Loan Amount |
|---|---|---|---|
| Open | Guzman Nick J De | $355,000 | |
| Closed | Deguzman Nick J | $145,195 |
Source: Public Records
Tax History Compared to Growth
Tax History
| Year | Tax Paid | Tax Assessment Tax Assessment Total Assessment is a certain percentage of the fair market value that is determined by local assessors to be the total taxable value of land and additions on the property. | Land | Improvement |
|---|---|---|---|---|
| 2025 | $3,553 | $245,893 | $92,205 | $153,688 |
| 2024 | $3,553 | $241,073 | $90,398 | $150,675 |
| 2023 | $3,439 | $236,347 | $88,626 | $147,721 |
| 2022 | $3,365 | $231,714 | $86,889 | $144,825 |
| 2021 | $3,304 | $227,172 | $85,186 | $141,986 |
| 2020 | $3,259 | $224,844 | $84,313 | $140,531 |
| 2019 | $3,199 | $220,436 | $82,660 | $137,776 |
| 2018 | $3,053 | $216,115 | $81,040 | $135,075 |
| 2016 | $2,831 | $202,009 | $77,519 | $124,490 |
| 2015 | $2,792 | $198,976 | $76,355 | $122,621 |
| 2014 | $2,783 | $195,080 | $74,860 | $120,220 |
Source: Public Records
Map
Nearby Homes
- 1721 Glenridge Cir
- 1727 E Natalie Ave
- 2426 S Nancy St
- 2418 Nina St
- 1725 E Nanette Ave
- 17350 Temple Ave Unit 320
- 17350 Temple Ave Unit 128
- 17350 Temple Ave Unit 81
- 17350 E Temple Ave Unit 52
- 17350 E Temple Ave Unit 270
- 17350 E Temple Ave Unit 84
- 2609 Greenleaf Dr
- 17103 Samgerry Dr
- 2733 Elena Ave
- 17003 Abell Ct
- 232 N Winton Ave
- 261 Zenith Ave
- 502 Mangate Ave
- 2600 Paseo Olivas
- 529 Raminda Ave
- 1749 Glenridge Cir
- 1757 Glenridge Cir
- 1752 Fairridge Cir
- 1745 Glenridge Cir
- 1756 Fairridge Cir
- 1748 Fairridge Cir
- 1744 Fairridge Cir
- 1741 Glenridge Cir
- 1748 Glenridge Cir
- 1752 Glenridge Cir
- 1744 Glenridge Cir
- 1756 Glenridge Cir
- 1740 Fairridge Cir
- 1737 Glenridge Cir
- 1740 Glenridge Cir
- 1736 Fairridge Cir
- 1736 Glenridge Cir
- 1753 Fairridge Cir
- 1733 Glenridge Cir
- 1753 E Oakridge Cir