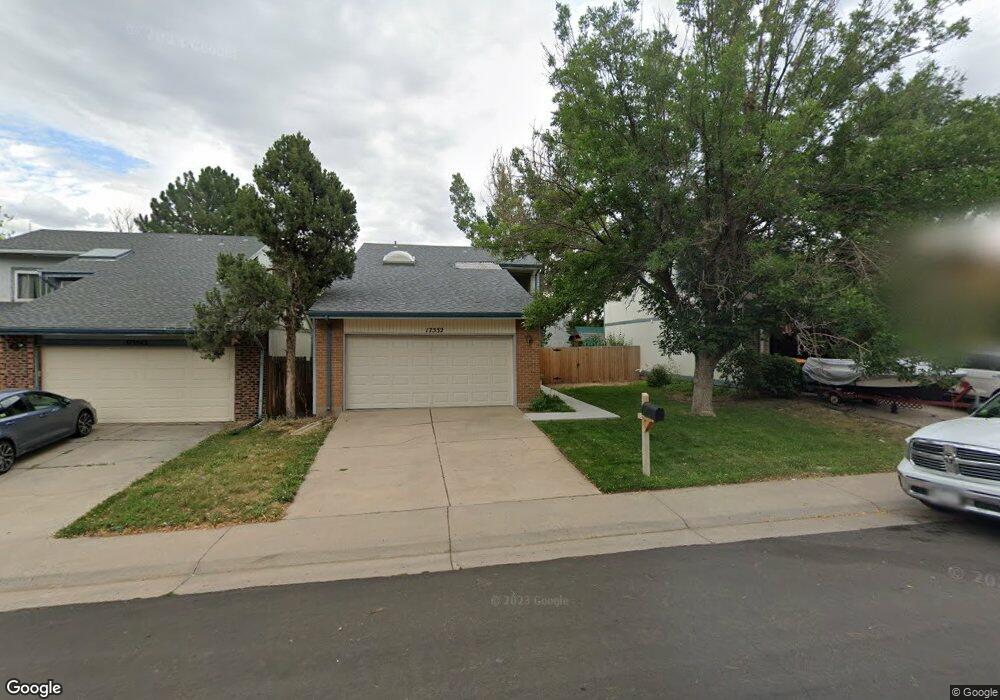
17532 E Ohio Cir Aurora, CO 80017
Tollgate Overlook NeighborhoodEstimated Value: $445,000 - $509,000
4
Beds
5
Baths
1,750
Sq Ft
$268/Sq Ft
Est. Value
About This Home
This home is located at 17532 E Ohio Cir, Aurora, CO 80017 and is currently estimated at $469,087, approximately $268 per square foot. 17532 E Ohio Cir is a home located in Arapahoe County with nearby schools including Iowa Elementary School, Mrachek Middle School, and Gateway High School.
Ownership History
Date
Name
Owned For
Owner Type
Purchase Details
Closed on
Jun 24, 2015
Sold by
Cartagena Sylvia D
Bought by
Sylvia D Cartagena Trust
Current Estimated Value
Home Financials for this Owner
Home Financials are based on the most recent Mortgage that was taken out on this home.
Original Mortgage
$30,000
Outstanding Balance
$23,170
Interest Rate
3.91%
Mortgage Type
Credit Line Revolving
Estimated Equity
$445,917
Purchase Details
Closed on
Aug 8, 2013
Sold by
Cartagena Sylvia D
Bought by
Sylvia D Cartagena Trust
Purchase Details
Closed on
Aug 27, 1998
Sold by
Wallace Thomas J and Wallace Joyce E
Bought by
Cartagena Sylvia D
Home Financials for this Owner
Home Financials are based on the most recent Mortgage that was taken out on this home.
Original Mortgage
$110,000
Outstanding Balance
$21,120
Interest Rate
6.9%
Estimated Equity
$447,967
Create a Home Valuation Report for This Property
The Home Valuation Report is an in-depth analysis detailing your home's value as well as a comparison with similar homes in the area
Home Values in the Area
Average Home Value in this Area
Purchase History
| Date | Buyer | Sale Price | Title Company |
|---|---|---|---|
| Sylvia D Cartagena Trust | -- | First American Title | |
| Sylvia D Cartagena Trust | -- | None Available | |
| Cartagena Sylvia D | $137,500 | -- |
Source: Public Records
Mortgage History
| Date | Status | Borrower | Loan Amount |
|---|---|---|---|
| Open | Sylvia D Cartagena Trust | $30,000 | |
| Open | Cartagena Sylvia D | $110,000 |
Source: Public Records
Tax History
| Year | Tax Paid | Tax Assessment Tax Assessment Total Assessment is a certain percentage of the fair market value that is determined by local assessors to be the total taxable value of land and additions on the property. | Land | Improvement |
|---|---|---|---|---|
| 2025 | $2,875 | $28,213 | -- | -- |
| 2024 | $2,789 | $30,003 | -- | -- |
| 2023 | $2,789 | $30,003 | $0 | $0 |
| 2022 | $2,388 | $23,783 | $0 | $0 |
| 2021 | $2,465 | $23,783 | $0 | $0 |
| 2020 | $2,351 | $22,580 | $0 | $0 |
| 2019 | $2,338 | $22,580 | $0 | $0 |
| 2018 | $2,126 | $20,102 | $0 | $0 |
| 2017 | $1,849 | $20,102 | $0 | $0 |
| 2016 | $1,448 | $15,411 | $0 | $0 |
| 2015 | $1,398 | $15,411 | $0 | $0 |
| 2014 | $1,050 | $11,152 | $0 | $0 |
| 2013 | -- | $12,940 | $0 | $0 |
Source: Public Records
Map
Nearby Homes
- 17815 E Ada Dr
- 841 S Uravan Ct
- 17716 E Ohio Cir
- 18004 E Ohio Ave Unit 101
- 18031 E Kentucky Ave Unit 202
- 18033 E Ohio Ave Unit 201
- 18064 E Ohio Ave Unit 204
- 18063 E Ohio Ave Unit 201
- 18103 E Kentucky Ave Unit 103
- 18103 E Kentucky Ave Unit 102
- 18196 E Ohio Ave Unit 201
- 17211 E Ford Dr
- 17256 E Ford Dr
- 17274 E Ford Dr
- 17286 E Ford Dr
- 1154 S Truckee Way
- 17215 E Alameda Pkwy
- 17205 E Alameda Pkwy
- 972 S Pitkin Ct
- 961 S Pitkin Ct
- 17522 E Ohio Cir
- 17542 E Ohio Cir
- 17552 E Ohio Cir
- 17512 E Ohio Cir
- 17733 E Ada Dr
- 17723 E Ada Dr
- 17743 E Ada Dr
- 17713 E Ada Dr
- 17562 E Ohio Cir
- 17502 E Ohio Cir
- 17753 E Ada Dr
- 17531 E Ohio Cir
- 17521 E Ohio Cir
- 17541 E Ohio Cir
- 17703 E Ada Dr
- 17551 E Ohio Cir
- 17511 E Ohio Cir
- 17763 E Ada Dr
- 17572 E Ohio Cir
- 17501 E Ohio Cir
Your Personal Tour Guide
Ask me questions while you tour the home.