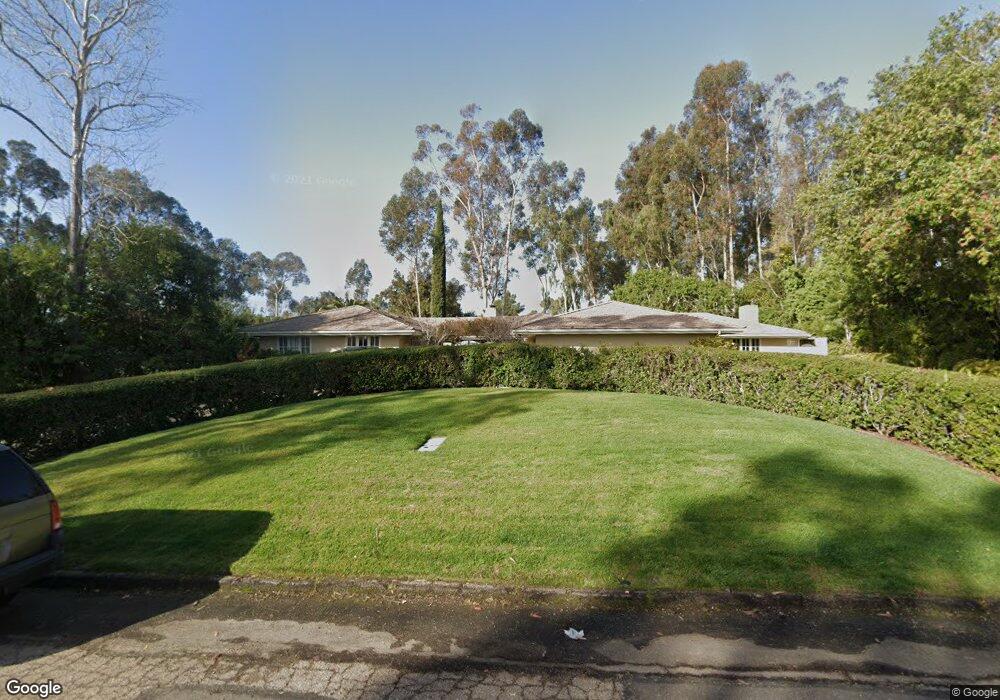
17532 Los Eucalitpos Rancho Santa Fe, CA 92067
Estimated Value: $3,752,949 - $5,160,000
3
Beds
4
Baths
4,012
Sq Ft
$1,075/Sq Ft
Est. Value
About This Home
This home is located at 17532 Los Eucalitpos, Rancho Santa Fe, CA 92067 and is currently estimated at $4,312,316, approximately $1,074 per square foot. 17532 Los Eucalitpos is a home located in San Diego County with nearby schools including R. Roger Rowe Elementary School, Torrey Pines High School, and Horizon Prep.
Ownership History
Date
Name
Owned For
Owner Type
Purchase Details
Closed on
Aug 3, 2021
Sold by
Sciacca Frank J
Bought by
Sciacca Frank J and Sciacca Kathryn Decourt
Current Estimated Value
Purchase Details
Closed on
Jun 16, 2010
Sold by
Sciacca Frank J
Bought by
Sciacca Frank J
Purchase Details
Closed on
Sep 17, 2007
Sold by
Sciacca Connie M
Bought by
Sciacca Frank J and Sciacca Connie M
Purchase Details
Closed on
Sep 6, 1994
Sold by
Sciacca Frank J
Bought by
Sciacca Connie M
Home Financials for this Owner
Home Financials are based on the most recent Mortgage that was taken out on this home.
Original Mortgage
$507,500
Outstanding Balance
$279,757
Interest Rate
8.57%
Estimated Equity
$4,032,559
Purchase Details
Closed on
May 5, 1994
Sold by
Beaton Alex
Bought by
Sciacca Connie M
Purchase Details
Closed on
Jun 3, 1988
Create a Home Valuation Report for This Property
The Home Valuation Report is an in-depth analysis detailing your home's value as well as a comparison with similar homes in the area
Home Values in the Area
Average Home Value in this Area
Purchase History
| Date | Buyer | Sale Price | Title Company |
|---|---|---|---|
| Sciacca Frank J | -- | None Available | |
| Sciacca Frank J | -- | None Available | |
| Sciacca Frank J | -- | None Available | |
| Sciacca Frank J | -- | None Available | |
| Sciacca Connie M | -- | Commonwealth Land Title Co | |
| Sciacca Connie M | -- | Commonwealth Land Title Co | |
| Beaton Alex | -- | Commonwealth Land Title Co | |
| -- | $680,000 | -- |
Source: Public Records
Mortgage History
| Date | Status | Borrower | Loan Amount |
|---|---|---|---|
| Open | Sciacca Connie M | $507,500 |
Source: Public Records
Tax History
| Year | Tax Paid | Tax Assessment Tax Assessment Total Assessment is a certain percentage of the fair market value that is determined by local assessors to be the total taxable value of land and additions on the property. | Land | Improvement |
|---|---|---|---|---|
| 2025 | $16,397 | $1,447,024 | $797,854 | $649,170 |
| 2024 | $16,397 | $1,418,652 | $782,210 | $636,442 |
| 2023 | $15,909 | $1,390,836 | $766,873 | $623,963 |
| 2022 | $15,688 | $1,363,566 | $751,837 | $611,729 |
| 2021 | $15,431 | $1,336,831 | $737,096 | $599,735 |
| 2020 | $15,296 | $1,323,124 | $729,538 | $593,586 |
| 2019 | $15,018 | $1,297,182 | $715,234 | $581,948 |
| 2018 | $14,769 | $1,271,748 | $701,210 | $570,538 |
| 2017 | $14,524 | $1,246,812 | $687,461 | $559,351 |
| 2016 | $14,035 | $1,222,366 | $673,982 | $548,384 |
| 2015 | $13,760 | $1,204,006 | $663,859 | $540,147 |
| 2014 | $13,499 | $1,180,422 | $650,855 | $529,567 |
Source: Public Records
Map
Nearby Homes
- 6141 Lago Lindo
- 6710 El Montevideo
- 6710 El Montevideo
- 6009 Mimulus
- 6525 Lago Lindo
- 6148 El Tordo
- 6870 La Valle Plateada
- 5618 Loma Verde Dr
- 17912 El Brazo Lot 77
- 6347 Las Colinas
- 6129 La Flecha
- 6152 Camino Selva
- 0 Loma de Caballo
- 7102 Via de Maya
- 5471 73 La Crescenta
- 6013 La Flecha
- 6449 Las Colinas
- 5929 Linea Del Cielo Unit Jacaranda
- 5927 Linea Del Cielo Unit Elm
- 18220 Via de Fortuna
- 17532 Los Eucaliptos
- 17540 Los Eucaliptos
- 17524 Los Eucaliptos
- 17541 Los Eucaliptos
- 6305 El Circulo
- 17548 Los Eucaliptos
- 17516 Los Eucaliptos
- 17556 Los Eucaliptos
- 6309 El Circulo
- 6310 El Circulo
- 17508 Los Eucaliptos
- 0000 Lago Lindo Unit A
- 17563 Los Eucaliptos
- 6277 Lago Lindo
- 17509 Los Eucaliptos
- 17572 Los Eucaliptos
- 17500 Los Eucaliptos
- 6250 Mimulus
- 6230 Lago Lindo
- 6323 Mimulus Unit 64
Your Personal Tour Guide
Ask me questions while you tour the home.